Scenarios to be compared: EMME 4.3.7 Base year scenario VS OpenPaths Base year scenarioPM
Scatterplot Comparison of PM Peak for WALK PRM modes assignment
Scatterplot comparison of PM Peak total actual in-vehicle travel time by walk premium
Intercept: 0.0070
Slope: 0.9924
R² Score: 0.9995
RMSE: 0.5857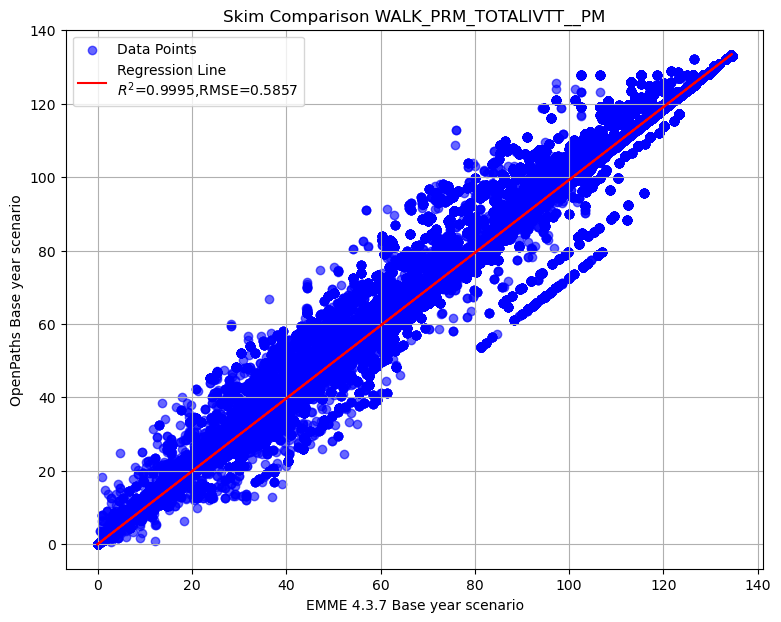
Scatterplot comparison of PM Peak actual in-vehicle travel time on LRT mode by walk premium
Intercept: 0.0040
Slope: 0.9950
R² Score: 0.9974
RMSE: 0.6290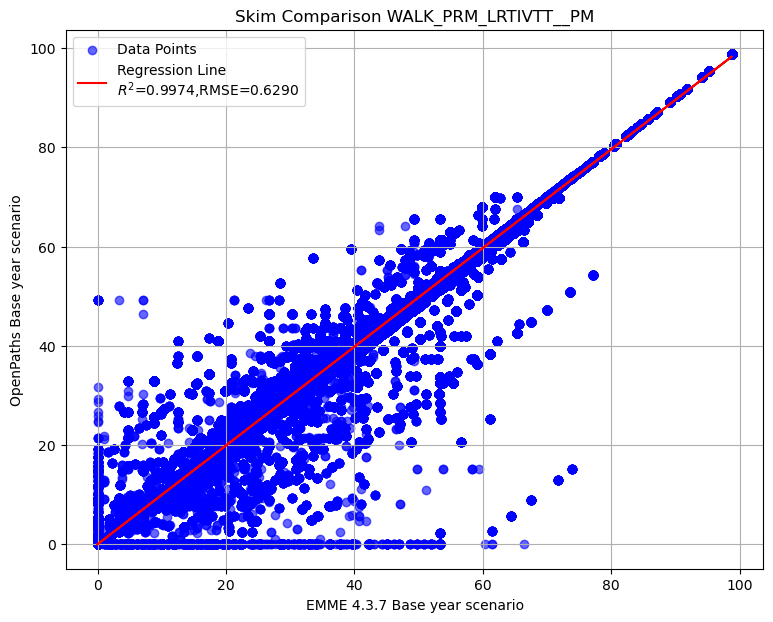
Scatterplot comparison of PM Peak actual in-vehicle travel time on commuter rail mode by walk premium
Intercept: 0.0019
Slope: 0.9851
R² Score: 0.9892
RMSE: 0.8708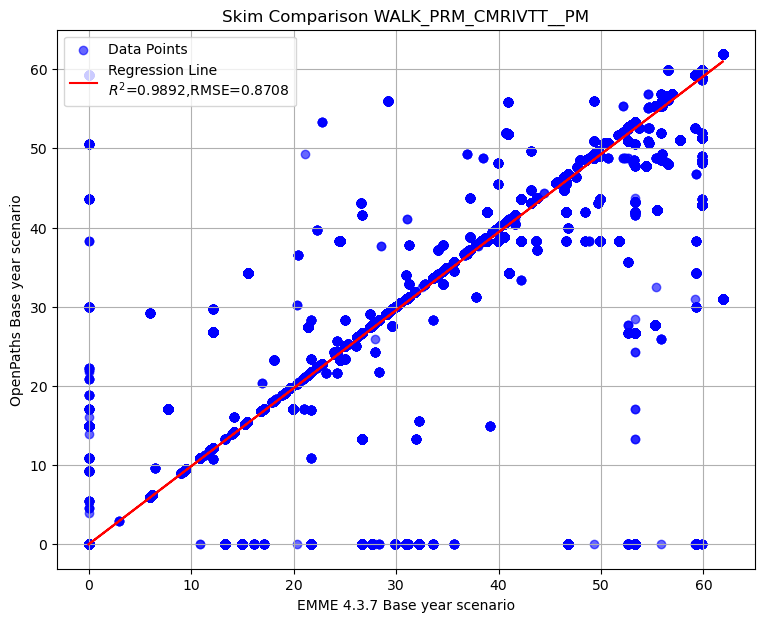
Scatterplot comparison of PM Peak actual in-vehicle travel time on express bus mode by walk premium
Intercept: 0.0126
Slope: 0.9755
R² Score: 0.9894
RMSE: 0.6729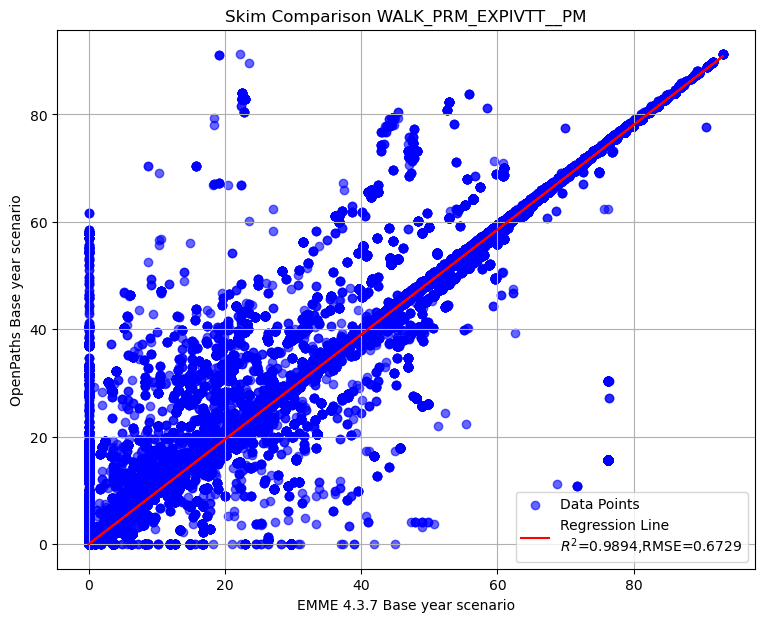
Scatterplot comparison of PM Peak actual in-vehicle travel time on BRT mode by walk premium
Intercept: 0.0335
Slope: 0.9873
R² Score: 0.9941
RMSE: 1.1278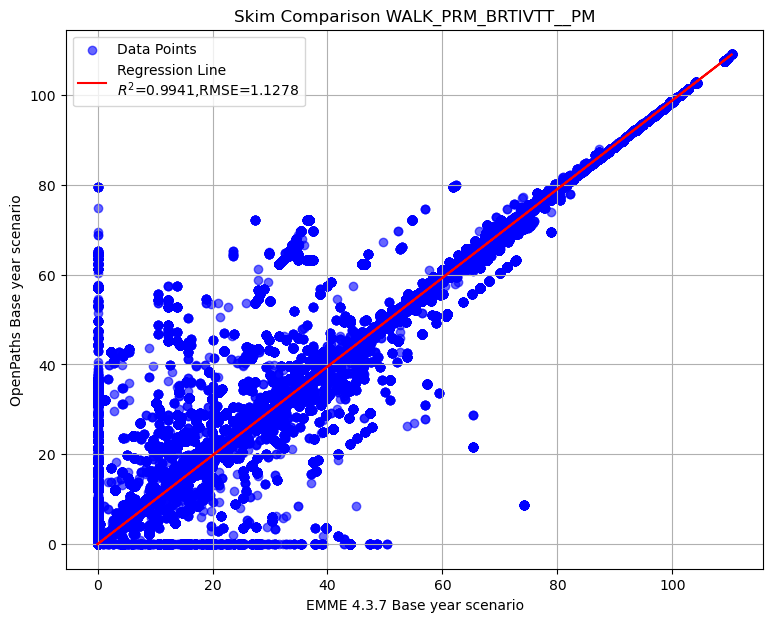
Intercept: 0.0303
Slope: 0.9936
R² Score: 0.9999
RMSE: 0.6129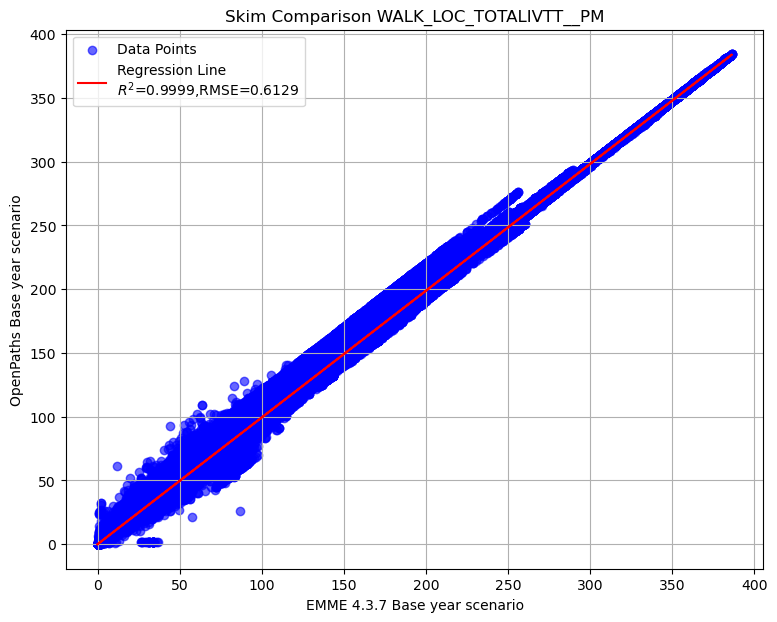
Intercept: 0.0770
Slope: 0.9928
R² Score: 0.9974
RMSE: 2.4413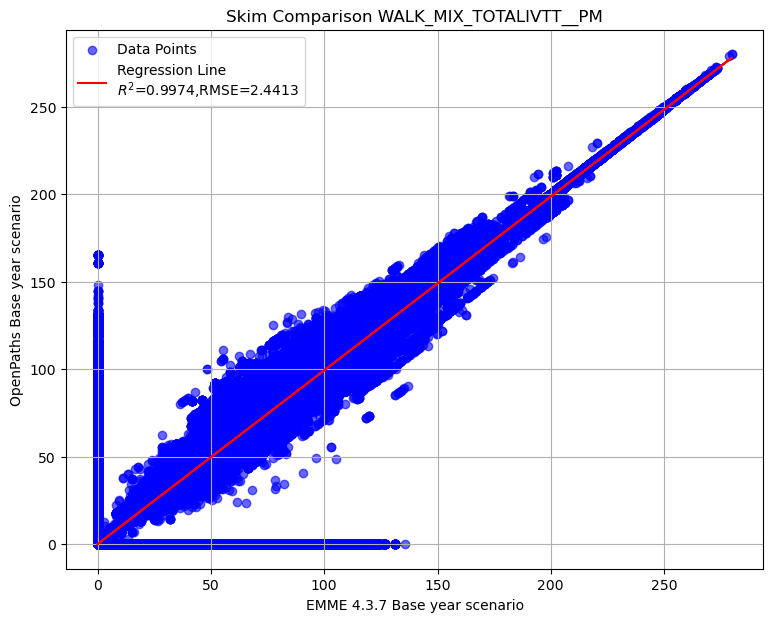
Summary of transit PM skim comparison (EMME OpenPath - EMME 4.3.7)
To display the top 5 rows of skim comparison (sort by WALK_PRM_TOTALIVTT__PM)
| Origin | Destination | WALK_PRM_TOTALIVTT__PM | WALK_PRM_LRTIVTT__PM | WALK_PRM_CMRIVTT__PM | WALK_PRM_EXPIVTT__PM | WALK_PRM_BRTIVTT__PM | WALK_LOC_TOTALIVTT__PM | WALK_MIX_TOTALIVTT__PM |
|---|---|---|---|---|---|---|---|---|
| 51 | 2191 | 36.74 | 42.12 | -52.63 | 8.97 | 38.28 | -0.95 | -0.33 |
| 51 | 2226 | 36.74 | 42.12 | -52.63 | 8.97 | 38.28 | -0.95 | -0.33 |
| 1835 | 2849 | 34.16 | 0 | 0 | 71.97 | -37.81 | 0 | 0 |
| 1835 | 2896 | 34.16 | 0 | 0 | 71.97 | -37.81 | 0 | 0 |
| 1835 | 3093 | 34.16 | 0 | 0 | 71.97 | -37.81 | 0 | 0 |
Below is the summary of select matrices difference in transit PM skim
| WALK_PRM_TOTALIVTT__PM | WALK_PRM_LRTIVTT__PM | WALK_PRM_CMRIVTT__PM | WALK_PRM_EXPIVTT__PM | WALK_PRM_BRTIVTT__PM | WALK_LOC_TOTALIVTT__PM | WALK_MIX_TOTALIVTT__PM | |
|---|---|---|---|---|---|---|---|
| count | 24,472,809.00 | 24,472,809.00 | 24,472,809.00 | 24,472,809.00 | 24,472,809.00 | 24,472,809.00 | 24,472,809.00 |
| mean | -0.09 | -0.02 | -0.02 | -0.02 | -0.03 | -0.47 | -0.21 |
| std | 0.62 | 0.63 | 0.88 | 0.69 | 1.14 | 0.82 | 2.47 |
| min | -27.77 | -66.45 | -59.88 | -60.92 | -65.61 | -60.45 | -135.80 |
| 25% | 0.00 | 0.00 | 0.00 | 0.00 | 0.00 | -1.05 | -0.23 |
| 50% | 0.00 | 0.00 | 0.00 | 0.00 | 0.00 | -0.10 | 0.00 |
| 75% | 0.00 | 0.00 | 0.00 | 0.00 | 0.00 | 0.00 | 0.00 |
| max | 36.74 | 49.24 | 59.22 | 71.97 | 79.44 | 49.22 | 165.12 |
Let’s check the records with difference in WALK_PRM_LRTIVTT__PM greater than 45
| Origin | Destination | WALK_PRM_TOTALIVTT__PM | WALK_PRM_LRTIVTT__PM | WALK_PRM_CMRIVTT__PM | WALK_PRM_EXPIVTT__PM | WALK_PRM_BRTIVTT__PM | WALK_LOC_TOTALIVTT__PM | WALK_MIX_TOTALIVTT__PM |
|---|---|---|---|---|---|---|---|---|
| 50 | 2764 | 11.45 | 49.24 | -52.63 | -38.89 | 53.72 | -1.33 | 0 |
| 51 | 2479 | 22.88 | 49.24 | -59.22 | 0 | 32.86 | -1.06 | 0 |
| 51 | 2757 | 20.03 | 49.24 | -59.22 | 0 | 30.01 | -1.19 | 0 |
| 70 | 2762 | 14.75 | 49.24 | -49.33 | -38.89 | 53.72 | -1.33 | 0 |
| 2391 | 57 | 24.27 | 49.24 | -53.29 | -26.31 | 54.62 | -1.21 | 0 |
| 2395 | 53 | 17.87 | 45.96 | -55.89 | 0 | 27.8 | -1.36 | 0 |
| 2601 | 53 | 25.21 | 49.24 | -59.88 | 0 | 35.85 | -1.51 | 0 |
| 2637 | 53 | 25.21 | 49.24 | -59.88 | 0 | 35.85 | -1.28 | 0 |
| 2640 | 53 | 25.21 | 49.24 | -59.88 | 0 | 35.85 | -1.28 | 0 |
| 2686 | 53 | 24.2 | 49.24 | -59.88 | 0 | 34.84 | -1.51 | 0 |
| 2761 | 53 | 25.21 | 49.24 | -59.88 | 0 | 35.85 | -1.53 | 0 |
| 2762 | 53 | 25.21 | 49.24 | -59.88 | 0 | 35.85 | -1.39 | 0 |
| 2764 | 53 | 25.21 | 49.24 | -59.88 | 0 | 35.85 | -1.28 | 0 |
| 2765 | 53 | 25.21 | 49.24 | -59.88 | 0 | 35.85 | -1.39 | 0 |
| 2766 | 53 | 25.21 | 49.24 | -59.88 | 0 | 35.85 | -1.52 | 0 |
| 2768 | 53 | 24.2 | 49.24 | -59.88 | 0 | 34.84 | -1.52 | 0 |
Let’s check the records with difference in WALK_PRM_LRTIVTT__PM less than -60
| Origin | Destination | WALK_PRM_TOTALIVTT__PM | WALK_PRM_LRTIVTT__PM | WALK_PRM_CMRIVTT__PM | WALK_PRM_EXPIVTT__PM | WALK_PRM_BRTIVTT__PM | WALK_LOC_TOTALIVTT__PM | WALK_MIX_TOTALIVTT__PM |
|---|---|---|---|---|---|---|---|---|
| 1244 | 3240 | -5.86 | -60.27 | 0 | 54.42 | 0 | -1.33 | 0 |
| 1255 | 3240 | -6.96 | -61.38 | 0 | 54.42 | 0 | -1.32 | 0 |
| 1272 | 3240 | -6.96 | -61.38 | 0 | 54.42 | 0 | -1.31 | 0 |
| 1428 | 3575 | -10.84 | -66.45 | 0 | 55.6 | 0 | -1.48 | -1.57 |