Scenarios to be compared: EMME 4.3.7 Base year scenario VS OpenPaths Base year scenarioAM
Scatterplot Comparison of AM Peak for WALK PRM modes assignment
Scatterplot comparison of AM Peak total actual in-vehicle travel time by walk premium
Intercept: 0.0063
Slope: 0.9926
R² Score: 0.9997
RMSE: 0.4609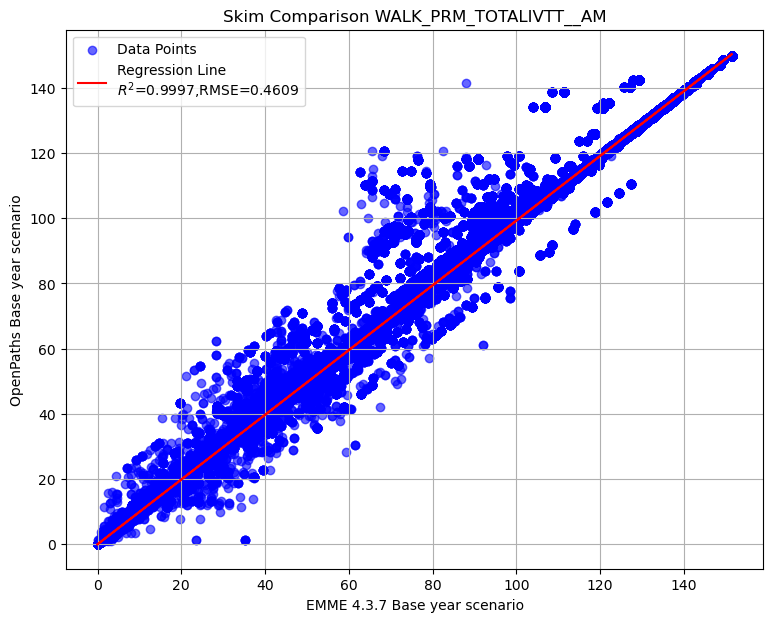
Scatterplot comparison of AM Peak actual in-vehicle travel time on LRT mode by walk premium
Intercept: 0.0016
Slope: 0.9997
R² Score: 0.9988
RMSE: 0.4303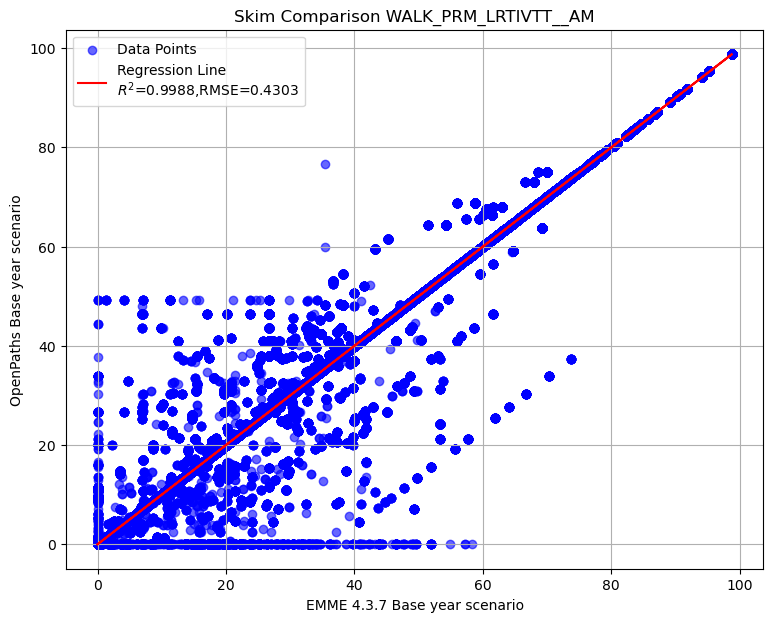
Scatterplot comparison of AM Peak actual in-vehicle travel time on commuter rail mode by walk premium
Intercept: -0.0020
Slope: 0.9906
R² Score: 0.9910
RMSE: 0.7346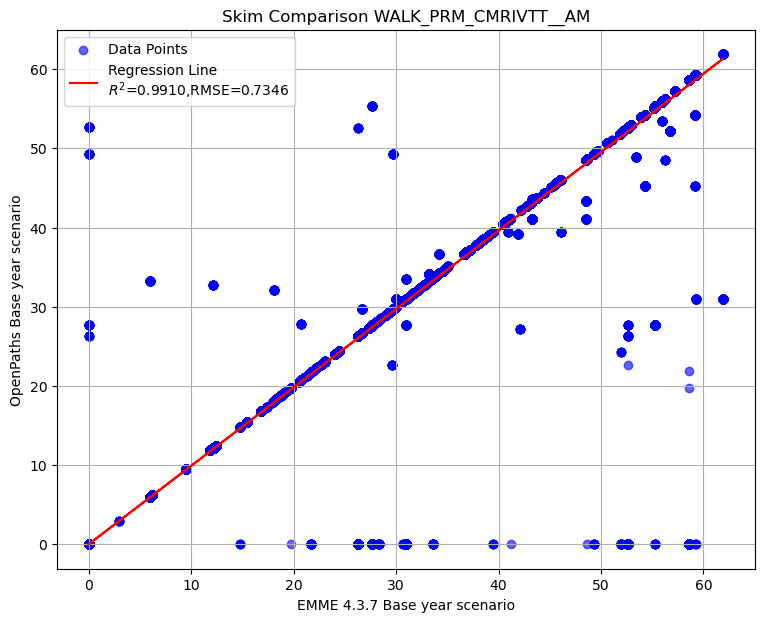
Scatterplot comparison of AM Peak actual in-vehicle travel time on express bus mode by walk premium
Intercept: 0.0025
Slope: 0.9850
R² Score: 0.9973
RMSE: 0.3476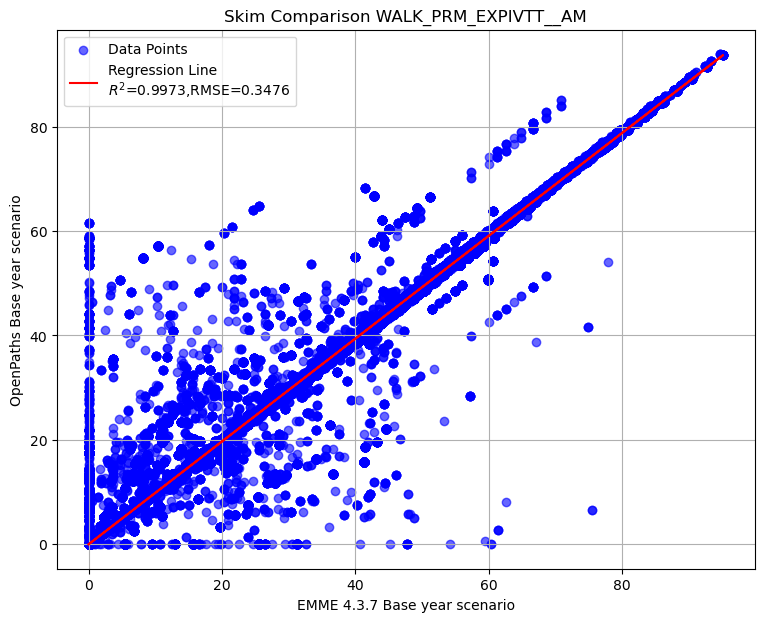
Scatterplot comparison of AM Peak actual in-vehicle travel time on BRT mode by walk premium
Intercept: 0.0165
Slope: 0.9856
R² Score: 0.9962
RMSE: 0.9373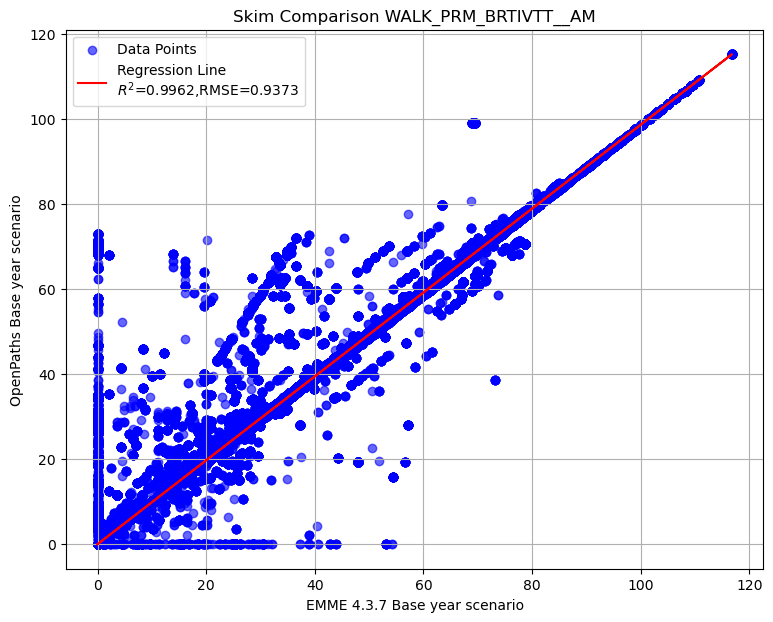
Intercept: 0.0454
Slope: 0.9937
R² Score: 0.9999
RMSE: 0.6308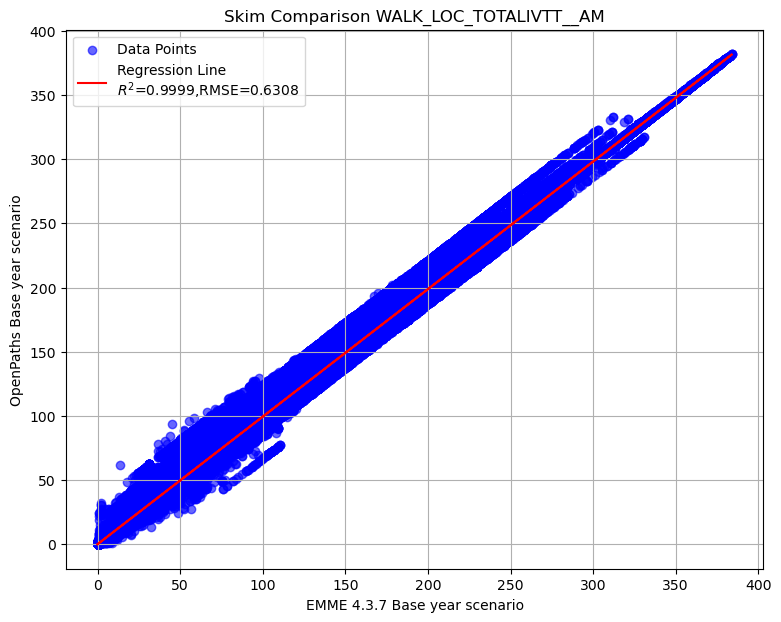
Intercept: 0.1327
Slope: 0.9933
R² Score: 0.9967
RMSE: 2.7843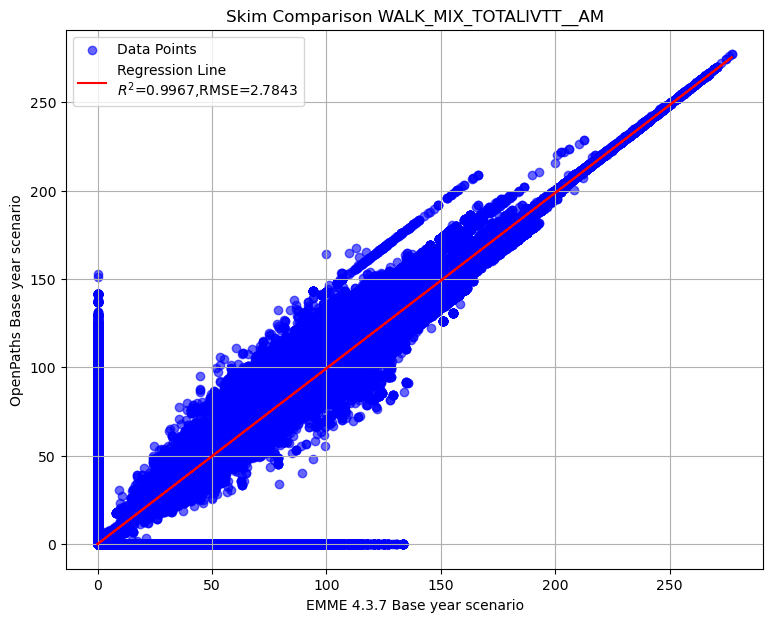
Summary of transit AM skim comparison (EMME OpenPath - EMME 4.3.7)
To display the top 5 rows of skim comparison (sort by WALK_PRM_TOTALIVTT__AM)
| Origin | Destination | WALK_PRM_TOTALIVTT__AM | WALK_PRM_LRTIVTT__AM | WALK_PRM_CMRIVTT__AM | WALK_PRM_EXPIVTT__AM | WALK_PRM_BRTIVTT__AM | WALK_LOC_TOTALIVTT__AM | WALK_MIX_TOTALIVTT__AM |
|---|---|---|---|---|---|---|---|---|
| 1933 | 112 | 55.04 | 36.61 | -58.57 | 8.89 | 68.11 | -1.3 | -0.01 |
| 3746 | 129 | 53.52 | 41.14 | -52.62 | 0 | 65 | -1.82 | -0.02 |
| 1933 | 151 | 52.18 | 33.76 | -58.57 | 8.89 | 68.11 | -1.33 | 0 |
| 1933 | 162 | 52.18 | 33.76 | -58.57 | 8.89 | 68.11 | -1.28 | -0.02 |
| 1933 | 141 | 52.18 | 33.76 | -58.57 | 8.89 | 68.11 | -1.33 | -0.03 |
Below is the summary of selected matrices difference in transit AM skim
| WALK_PRM_TOTALIVTT__AM | WALK_PRM_LRTIVTT__AM | WALK_PRM_CMRIVTT__AM | WALK_PRM_EXPIVTT__AM | WALK_PRM_BRTIVTT__AM | WALK_LOC_TOTALIVTT__AM | WALK_MIX_TOTALIVTT__AM | |
|---|---|---|---|---|---|---|---|
| count | 24,472,809.00 | 24,472,809.00 | 24,472,809.00 | 24,472,809.00 | 24,472,809.00 | 24,472,809.00 | 24,472,809.00 |
| mean | -0.09 | 0.00 | -0.02 | -0.02 | -0.05 | -0.44 | -0.14 |
| std | 0.50 | 0.43 | 0.74 | 0.36 | 0.96 | 0.82 | 2.80 |
| min | -33.82 | -58.35 | -59.24 | -68.82 | -54.15 | -33.19 | -133.54 |
| 25% | 0.00 | 0.00 | 0.00 | 0.00 | 0.00 | -0.82 | -0.19 |
| 50% | 0.00 | 0.00 | 0.00 | 0.00 | 0.00 | -0.07 | 0.00 |
| 75% | 0.00 | 0.00 | 0.00 | 0.00 | 0.00 | 0.00 | 0.00 |
| max | 55.04 | 49.24 | 52.65 | 61.51 | 72.95 | 48.56 | 152.59 |
Let’s check the records with difference in WALK_PRM_LRTIVTT__AM greater than 50
| Origin | Destination | WALK_PRM_TOTALIVTT__AM | WALK_PRM_LRTIVTT__AM | WALK_PRM_CMRIVTT__AM | WALK_PRM_EXPIVTT__AM | WALK_PRM_BRTIVTT__AM | WALK_LOC_TOTALIVTT__AM | WALK_MIX_TOTALIVTT__AM |
|---|
Let’s check the records with difference in WALK_PRM_LRTIVTT__AM less than -50
| Origin | Destination | WALK_PRM_TOTALIVTT__AM | WALK_PRM_LRTIVTT__AM | WALK_PRM_CMRIVTT__AM | WALK_PRM_EXPIVTT__AM | WALK_PRM_BRTIVTT__AM | WALK_LOC_TOTALIVTT__AM | WALK_MIX_TOTALIVTT__AM |
|---|---|---|---|---|---|---|---|---|
| 2627 | 1190 | 2.93 | -51.9 | 0 | 54.84 | 0 | -1.69 | -0.12 |
| 2627 | 1199 | 2.93 | -51.9 | 0 | 54.84 | 0 | -1.69 | -0.12 |
| 2641 | 1190 | 2.93 | -51.9 | 0 | 54.84 | 0 | -1.63 | 0 |
| 2641 | 1199 | 2.93 | -51.9 | 0 | 54.84 | 0 | -1.63 | 0 |
| 2650 | 1190 | 2.93 | -51.9 | 0 | 54.84 | 0 | -1.63 | 0 |
| 2650 | 1199 | 2.93 | -51.9 | 0 | 54.84 | 0 | -1.63 | 0 |
| 2713 | 1190 | 2.93 | -51.9 | 0 | 54.84 | 0 | -1.63 | 0 |
| 2713 | 1199 | 2.93 | -51.9 | 0 | 54.84 | 0 | -1.63 | 0 |
| 2726 | 1190 | 2.93 | -51.9 | 0 | 54.84 | 0 | -1.64 | -0.13 |
| 2726 | 1199 | 2.93 | -51.9 | 0 | 54.84 | 0 | -1.64 | -0.13 |
| 2743 | 1190 | 2.93 | -51.9 | 0 | 54.84 | 0 | -1.63 | 0 |
| 2743 | 1199 | 2.93 | -51.9 | 0 | 54.84 | 0 | -1.63 | 0 |
| 3186 | 1190 | -0.15 | -57.25 | 0 | 57.1 | 0 | -1.64 | 0 |
| 3186 | 1199 | -0.15 | -57.25 | 0 | 57.1 | 0 | -1.64 | 0 |
| 3186 | 1291 | 0.8 | -54.96 | 0 | 55.76 | 0 | -1.64 | 0 |
| 3240 | 1354 | -2.59 | -58.35 | 0 | 55.76 | 0 | -1.53 | 0 |