Scenarios to be compared: EMME 4.3.7 Initialization VS EMME OpenPath InitializationTest 2
Scatterplot Comparison of AM Peak for WALK PRM modes assignment
Scatterplot comparison of AM Peak total actual in-vehicle travel time by walk premium
Intercept: 0.0036
Slope: 1.0008
R² Score: 0.9997
RMSE: 0.4779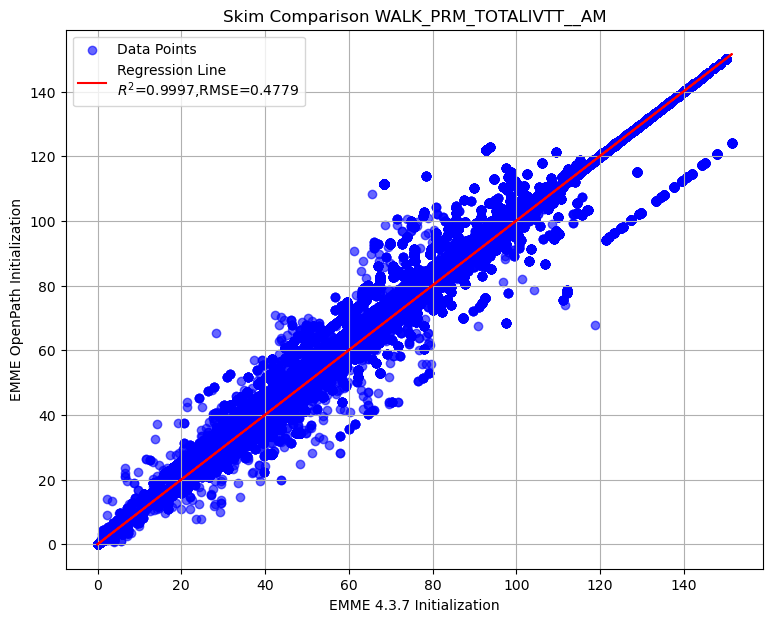
Scatterplot comparison of AM Peak actual in-vehicle travel time on LRT mode by walk premium
Intercept: 0.0083
Slope: 0.9991
R² Score: 0.9985
RMSE: 0.4922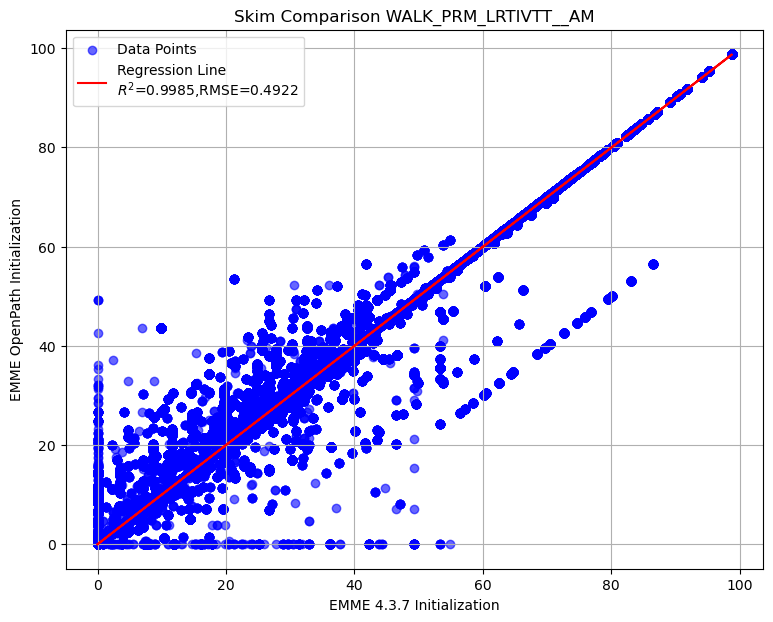
Scatterplot comparison of AM Peak actual in-vehicle travel time on commuter rail mode by walk premium
Intercept: 0.0053
Slope: 1.0011
R² Score: 0.9948
RMSE: 0.5589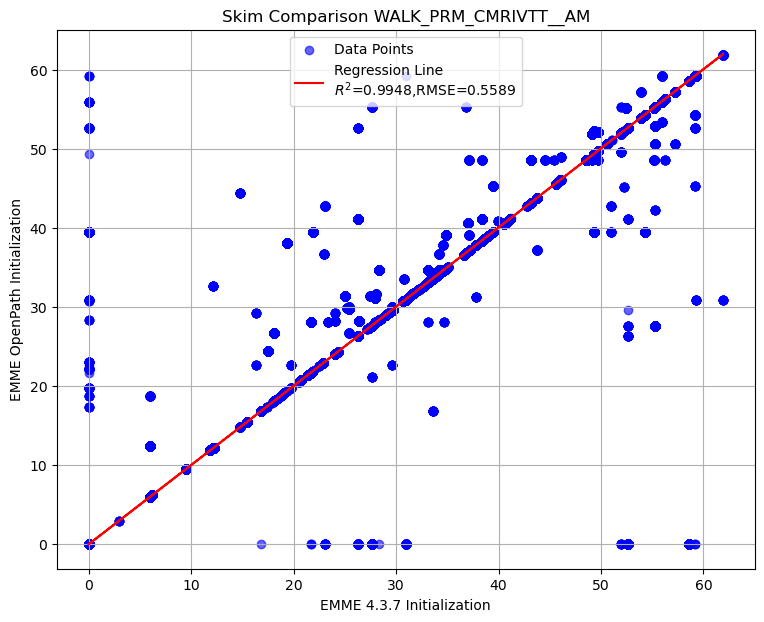
Scatterplot comparison of AM Peak actual in-vehicle travel time on express bus mode by walk premium
Intercept: 0.0019
Slope: 0.9982
R² Score: 0.9982
RMSE: 0.2853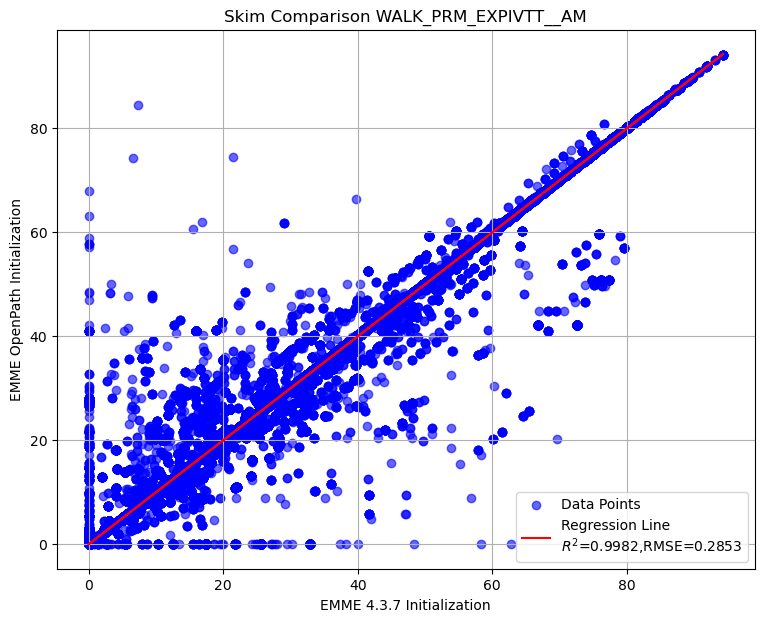
Scatterplot comparison of AM Peak actual in-vehicle travel time on BRT mode by walk premium
Intercept: 0.0057
Slope: 0.9996
R² Score: 0.9979
RMSE: 0.6946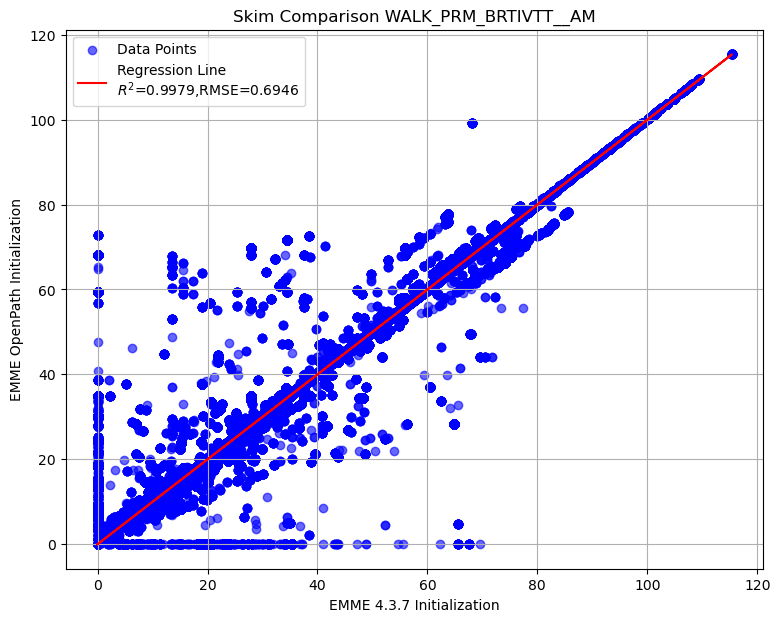
Intercept: -0.0050
Slope: 1.0010
R² Score: 1.0000
RMSE: 0.3886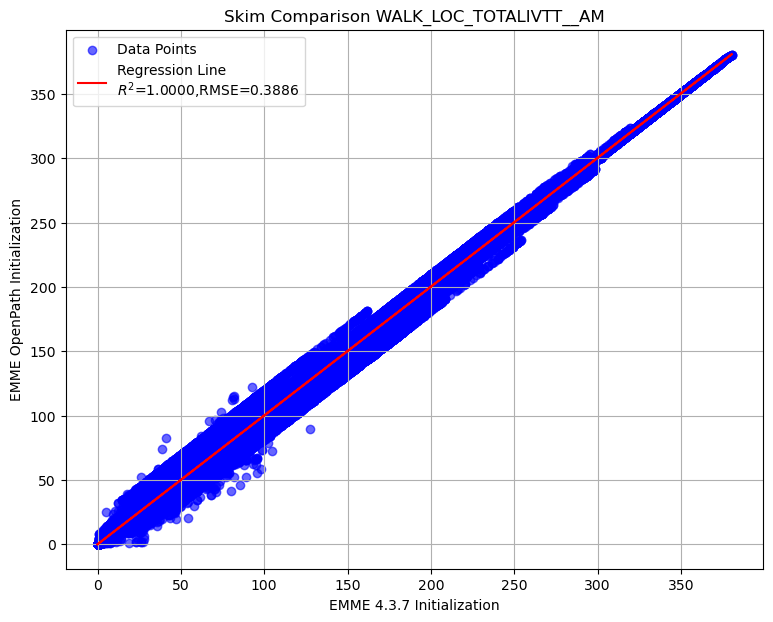
Intercept: 0.1064
Slope: 0.9988
R² Score: 0.9977
RMSE: 2.3245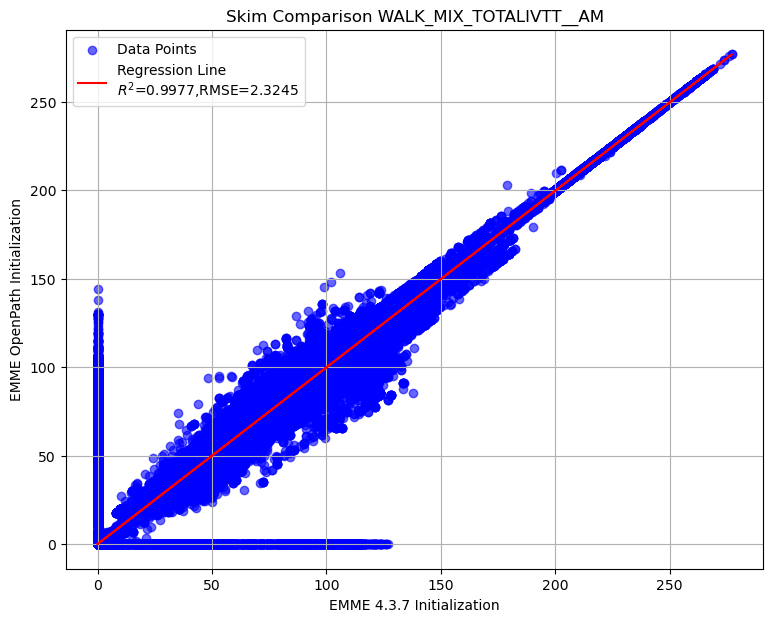
Summary of transit AM skim comparison (EMME OpenPath - EMME 4.3.7)
To display the top 5 rows of skim comparison (sort by WALK_PRM_TOTALIVTT__AM)
| Origin | Destination | WALK_PRM_TOTALIVTT__AM | WALK_PRM_LRTIVTT__AM | WALK_PRM_CMRIVTT__AM | WALK_PRM_EXPIVTT__AM | WALK_PRM_BRTIVTT__AM | WALK_LOC_TOTALIVTT__AM | WALK_MIX_TOTALIVTT__AM |
|---|---|---|---|---|---|---|---|---|
| 1896 | 150 | 43.18 | 33.76 | -58.57 | 0 | 68 | 0.33 | 0 |
| 1895 | 138 | 43.18 | 33.76 | -58.57 | 0 | 68 | 0.33 | 0 |
| 1895 | 160 | 43.18 | 33.76 | -58.57 | 0 | 68 | 0.34 | 0 |
| 1895 | 154 | 43.18 | 33.76 | -58.57 | 0 | 68 | 0.35 | 0 |
| 1895 | 151 | 43.18 | 33.76 | -58.57 | 0 | 68 | 0.34 | 0 |
Below is the summary of selected matrices difference in transit AM skim
| WALK_PRM_TOTALIVTT__AM | WALK_PRM_LRTIVTT__AM | WALK_PRM_CMRIVTT__AM | WALK_PRM_EXPIVTT__AM | WALK_PRM_BRTIVTT__AM | WALK_LOC_TOTALIVTT__AM | WALK_MIX_TOTALIVTT__AM | |
|---|---|---|---|---|---|---|---|
| count | 24,472,809.00 | 24,472,809.00 | 24,472,809.00 | 24,472,809.00 | 24,472,809.00 | 24,472,809.00 | 24,472,809.00 |
| mean | 0.01 | 0.00 | 0.01 | -0.00 | 0.00 | 0.07 | 0.06 |
| std | 0.48 | 0.49 | 0.56 | 0.29 | 0.69 | 0.40 | 2.33 |
| min | -50.86 | -54.96 | -59.21 | -62.87 | -69.54 | -40.43 | -127.03 |
| 25% | 0.00 | 0.00 | 0.00 | 0.00 | 0.00 | 0.00 | -0.00 |
| 50% | 0.00 | 0.00 | 0.00 | 0.00 | 0.00 | 0.00 | 0.00 |
| 75% | 0.00 | 0.00 | 0.00 | 0.00 | 0.00 | 0.09 | 0.00 |
| max | 43.18 | 49.24 | 59.24 | 77.12 | 72.90 | 41.62 | 144.49 |
Let’s check the records with difference in WALK_PRM_LRTIVTT__AM greater than 50
| Origin | Destination | WALK_PRM_TOTALIVTT__AM | WALK_PRM_LRTIVTT__AM | WALK_PRM_CMRIVTT__AM | WALK_PRM_EXPIVTT__AM | WALK_PRM_BRTIVTT__AM | WALK_LOC_TOTALIVTT__AM | WALK_MIX_TOTALIVTT__AM |
|---|---|---|---|---|---|---|---|---|
| 2538 | 52 | 23.52 | 49.24 | -59.21 | 0 | 33.49 | 0.38 | 0 |
| 2547 | 44 | 23.52 | 49.24 | -59.21 | 0 | 33.49 | 0.38 | 0 |
| 2600 | 44 | 23.52 | 49.24 | -59.21 | 0 | 33.49 | 0.38 | 0 |
Let’s check the records with difference in WALK_PRM_LRTIVTT__AM less than -50
| Origin | Destination | WALK_PRM_TOTALIVTT__AM | WALK_PRM_LRTIVTT__AM | WALK_PRM_CMRIVTT__AM | WALK_PRM_EXPIVTT__AM | WALK_PRM_BRTIVTT__AM | WALK_LOC_TOTALIVTT__AM | WALK_MIX_TOTALIVTT__AM |
|---|---|---|---|---|---|---|---|---|
| 24 | 2364 | -10.25 | -53.38 | 59.24 | 0 | -16.1 | -0.1 | 0 |
| 24 | 2398 | -10.25 | -53.38 | 59.24 | 0 | -16.1 | -0.1 | 0 |
| 24 | 2420 | -10.25 | -53.38 | 59.24 | 0 | -16.1 | -0.1 | 0 |
| 24 | 2436 | -10.25 | -53.38 | 59.24 | 0 | -16.1 | -0.1 | 0 |
| 24 | 2526 | -10.25 | -53.38 | 59.24 | 0 | -16.1 | -0.1 | 0 |
| 3186 | 1291 | 2.2 | -54.96 | 0 | 57.15 | 0 | 0.44 | 0 |