Scenarios to be compared: EMME 4.3.7 Base Year Scenario VS EMME 4.3.7 Base Year Scenario with rerun Transit AssignmentEMME 4.3.7 Rerun Transit Assignment
Scatterplot Comparison of AM Peak for WALK PRM modes assignment
Scatterplot comparison of AM Peak total actual in-vehicle travel time by walk premium
Intercept: 0.0000
Slope: 1.0000
R² Score: 1.0000
RMSE: 0.0189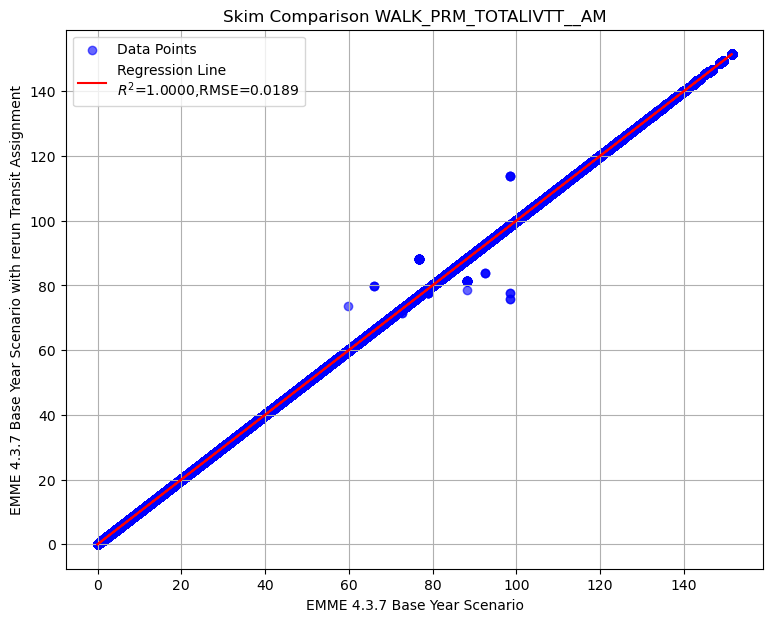
Scatterplot comparison of AM Peak actual in-vehicle travel time on LRT mode by walk premium
Intercept: -0.0000
Slope: 1.0000
R² Score: 1.0000
RMSE: 0.0156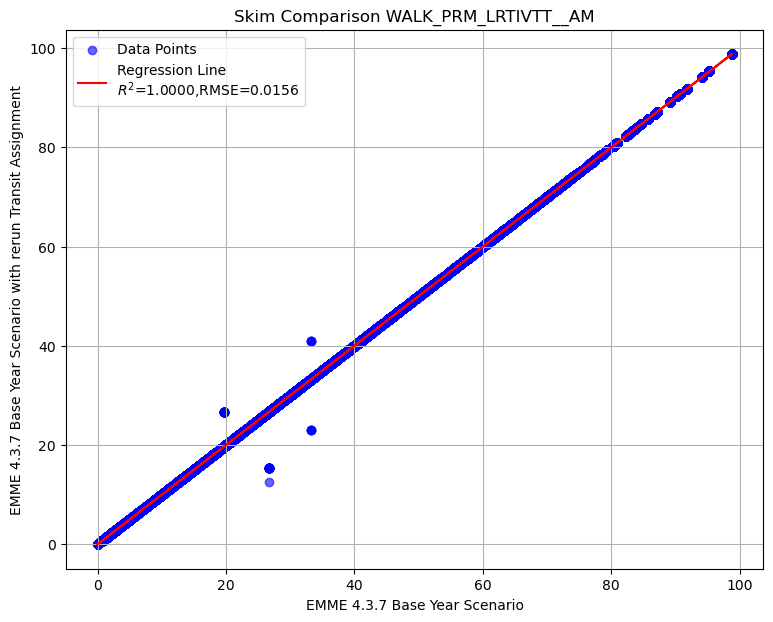
Scatterplot comparison of AM Peak actual in-vehicle travel time on commuter rail mode by walk premium
Intercept: 0.0000
Slope: 1.0000
R² Score: 1.0000
RMSE: 0.0451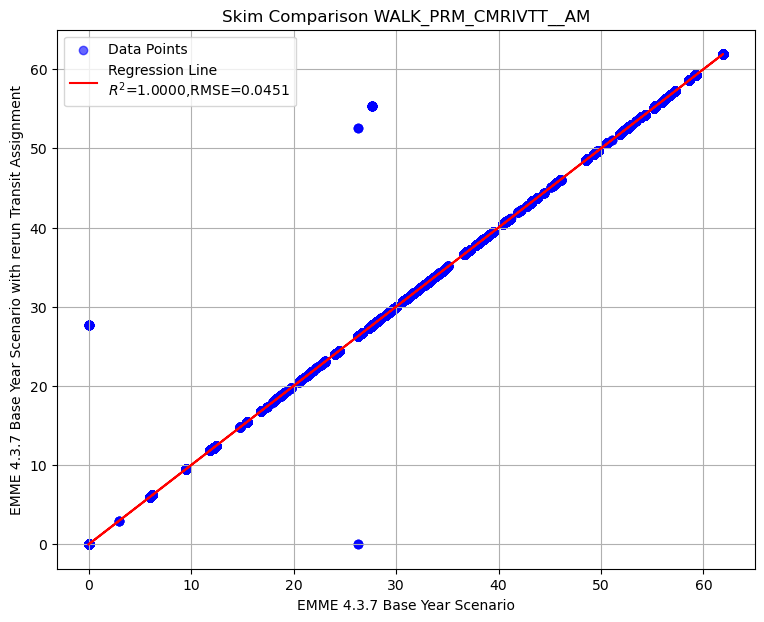
Scatterplot comparison of AM Peak actual in-vehicle travel time on express bus mode by walk premium
Intercept: 0.0000
Slope: 1.0000
R² Score: 1.0000
RMSE: 0.0082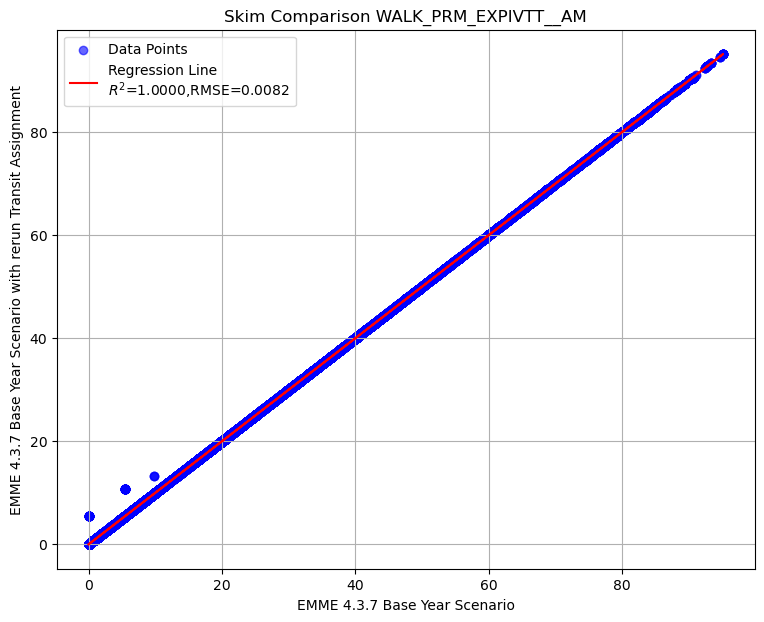
Scatterplot comparison of AM Peak actual in-vehicle travel time on BRT mode by walk premium
Intercept: -0.0000
Slope: 1.0000
R² Score: 1.0000
RMSE: 0.0489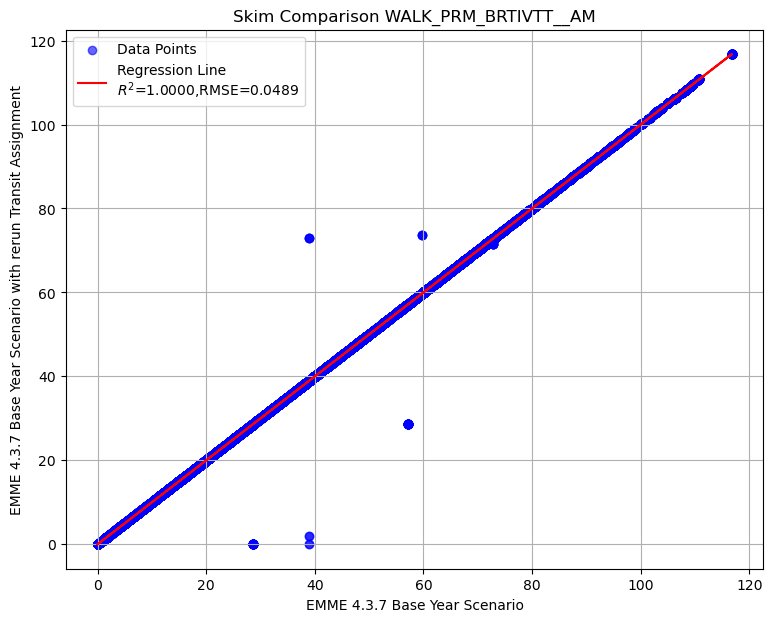
Intercept: -0.0000
Slope: 1.0000
R² Score: 1.0000
RMSE: 0.0000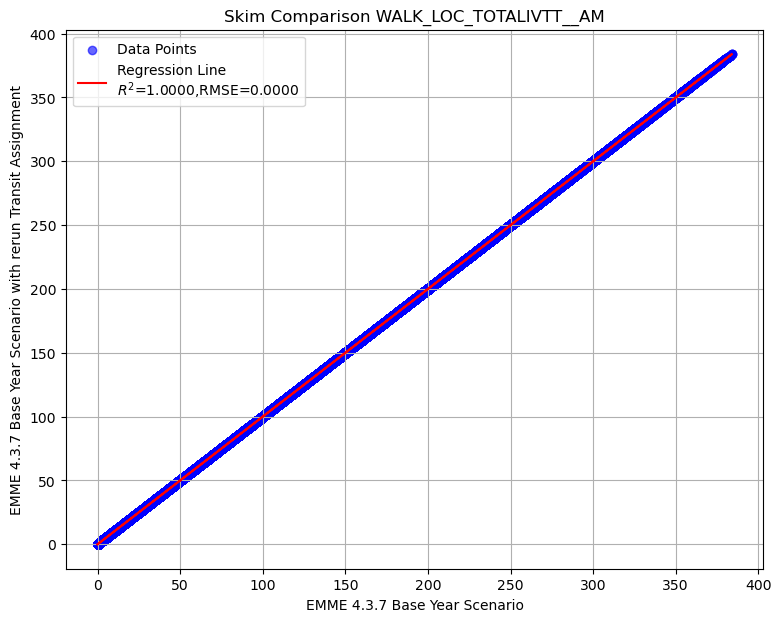
Intercept: -0.0000
Slope: 1.0000
R² Score: 1.0000
RMSE: 0.0000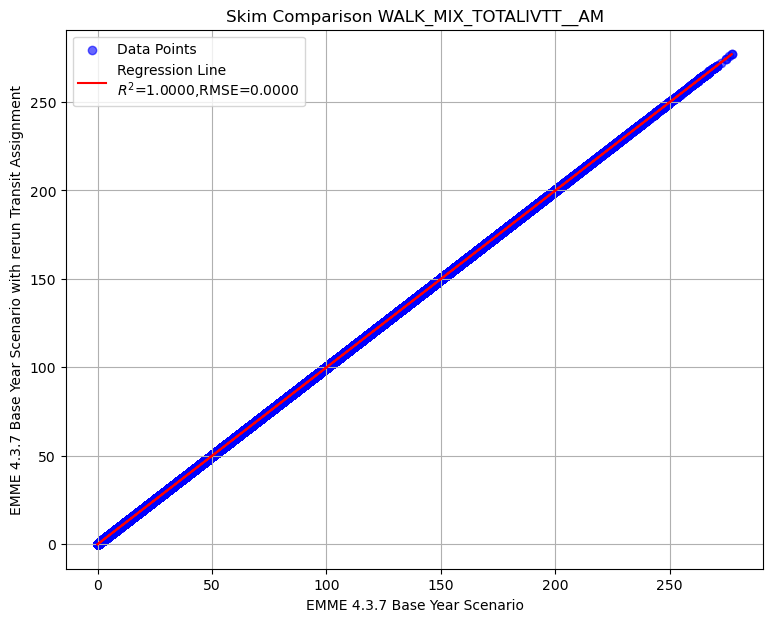
Summary of transit AM skim comparison (EMME 4.3.7 Rerun Transit Assignment - EMME 4.3.7)
To display the top 5 rows of skim comparison (sort by WALK_PRM_TOTALIVTT__AM)
| Origin | Destination | WALK_PRM_TOTALIVTT__AM | WALK_PRM_LRTIVTT__AM | WALK_PRM_CMRIVTT__AM | WALK_PRM_EXPIVTT__AM | WALK_PRM_BRTIVTT__AM | WALK_LOC_TOTALIVTT__AM | WALK_MIX_TOTALIVTT__AM |
|---|---|---|---|---|---|---|---|---|
| 789 | 176 | 15.48 | 7.56 | -26.31 | 0 | 34.22 | 0 | 0 |
| 699 | 176 | 15.48 | 7.56 | -26.31 | 0 | 34.22 | 0 | 0 |
| 814 | 176 | 15.48 | 7.56 | -26.31 | 0 | 34.22 | 0 | 0 |
| 629 | 176 | 15.48 | 7.56 | -26.31 | 0 | 34.22 | 0 | 0 |
| 3140 | 1338 | 13.98 | 0 | 0 | 0 | 13.98 | 0 | 0 |
Below is the summary of selected matrices difference in transit AM skim
| WALK_PRM_TOTALIVTT__AM | WALK_PRM_LRTIVTT__AM | WALK_PRM_CMRIVTT__AM | WALK_PRM_EXPIVTT__AM | WALK_PRM_BRTIVTT__AM | WALK_LOC_TOTALIVTT__AM | WALK_MIX_TOTALIVTT__AM | |
|---|---|---|---|---|---|---|---|
| count | 24,472,809.00 | 24,472,809.00 | 24,472,809.00 | 24,472,809.00 | 24,472,809.00 | 24,472,809.00 | 24,472,809.00 |
| mean | 0.00 | -0.00 | 0.00 | 0.00 | -0.00 | 0.00 | 0.00 |
| std | 0.02 | 0.02 | 0.05 | 0.01 | 0.05 | 0.00 | 0.00 |
| min | -22.81 | -14.18 | -26.31 | -0.00 | -38.86 | -0.00 | -0.00 |
| 25% | 0.00 | 0.00 | 0.00 | 0.00 | 0.00 | 0.00 | 0.00 |
| 50% | 0.00 | 0.00 | 0.00 | 0.00 | 0.00 | 0.00 | 0.00 |
| 75% | 0.00 | 0.00 | 0.00 | 0.00 | 0.00 | 0.00 | 0.00 |
| max | 15.48 | 7.56 | 27.65 | 5.39 | 34.22 | 0.00 | 0.00 |
Let’s check the records with difference in WALK_PRM_LRTIVTT__AM greater than 50
| Origin | Destination | WALK_PRM_TOTALIVTT__AM | WALK_PRM_LRTIVTT__AM | WALK_PRM_CMRIVTT__AM | WALK_PRM_EXPIVTT__AM | WALK_PRM_BRTIVTT__AM | WALK_LOC_TOTALIVTT__AM | WALK_MIX_TOTALIVTT__AM |
|---|---|---|---|---|---|---|---|---|
| 629 | 176 | 15.48 | 7.56 | -26.31 | 0 | 34.22 | 0 | 0 |
| 699 | 176 | 15.48 | 7.56 | -26.31 | 0 | 34.22 | 0 | 0 |
| 789 | 176 | 15.48 | 7.56 | -26.31 | 0 | 34.22 | 0 | 0 |
| 814 | 176 | 15.48 | 7.56 | -26.31 | 0 | 34.22 | 0 | 0 |
Let’s check the records with difference in WALK_PRM_LRTIVTT__AM less than -50
| Origin | Destination | WALK_PRM_TOTALIVTT__AM | WALK_PRM_LRTIVTT__AM | WALK_PRM_CMRIVTT__AM | WALK_PRM_EXPIVTT__AM | WALK_PRM_BRTIVTT__AM | WALK_LOC_TOTALIVTT__AM | WALK_MIX_TOTALIVTT__AM |
|---|---|---|---|---|---|---|---|---|
| 268 | 1472 | -9.71 | -14.18 | 27.65 | 5.39 | -28.57 | 0 | 0 |