Scenarios to be compared: EMME 4.3.7 Original Demand VS EMME 4.3.7 Observed Demand (OBS)EMME 4.3.7
Scatterplot Comparison of AM Peak for WALK PRM modes assignment
Scatterplot comparison of AM Peak total actual in-vehicle travel time by walk premium
Intercept: 0.0000
Slope: 1.0000
R² Score: 1.0000
RMSE: 0.0353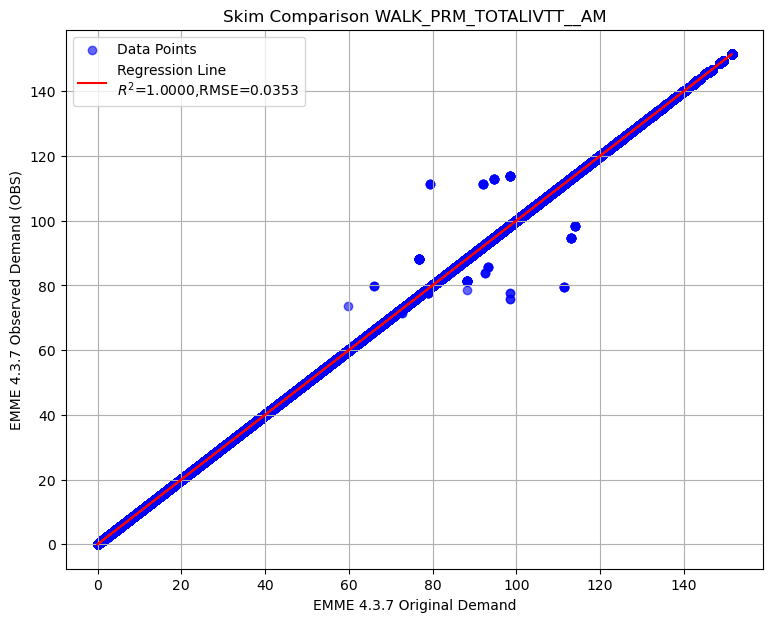
Scatterplot comparison of AM Peak actual in-vehicle travel time on LRT mode by walk premium
Intercept: 0.0000
Slope: 1.0000
R² Score: 1.0000
RMSE: 0.0233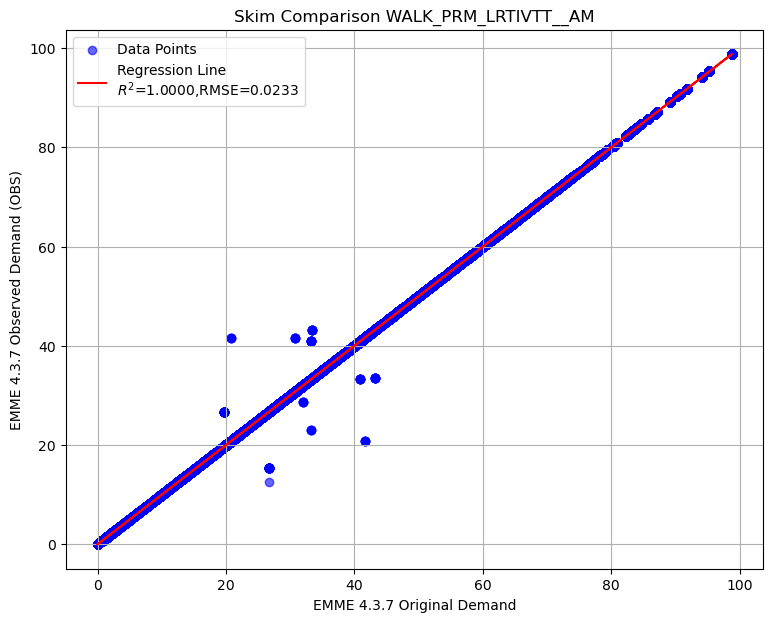
Scatterplot comparison of AM Peak actual in-vehicle travel time on commuter rail mode by walk premium
Intercept: 0.0001
Slope: 1.0000
R² Score: 0.9999
RMSE: 0.0667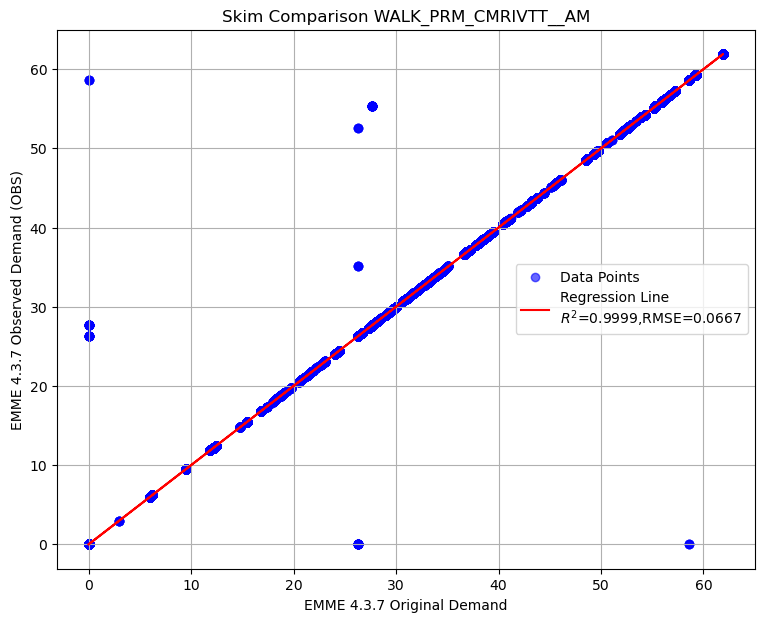
Scatterplot comparison of AM Peak actual in-vehicle travel time on express bus mode by walk premium
Intercept: 0.0000
Slope: 1.0000
R² Score: 1.0000
RMSE: 0.0082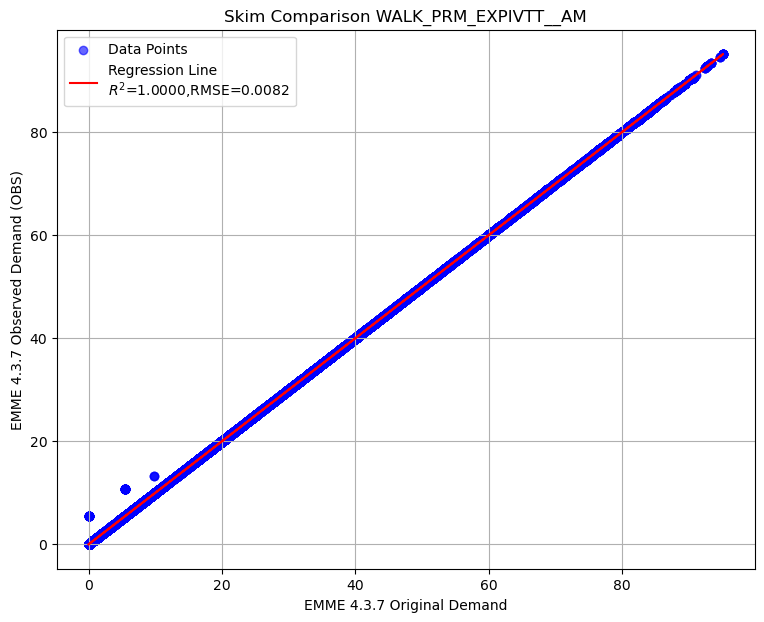
Scatterplot comparison of AM Peak actual in-vehicle travel time on BRT mode by walk premium
Intercept: 0.0000
Slope: 1.0000
R² Score: 1.0000
RMSE: 0.0786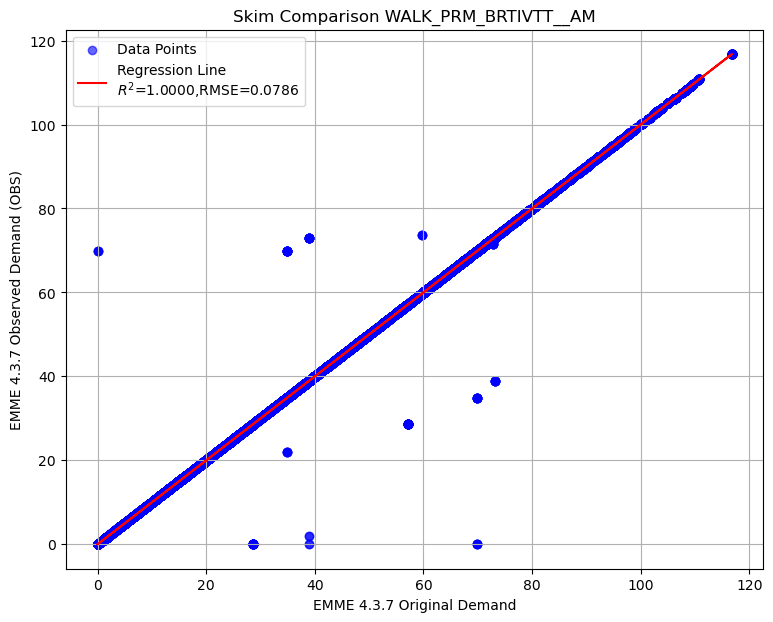
Intercept: -0.0000
Slope: 1.0000
R² Score: 1.0000
RMSE: 0.0000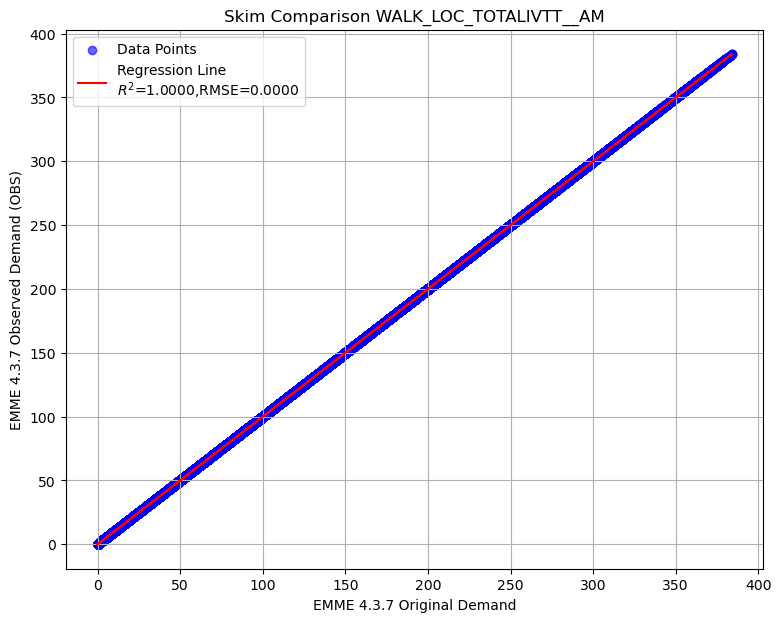
Intercept: -0.0000
Slope: 1.0000
R² Score: 1.0000
RMSE: 0.0000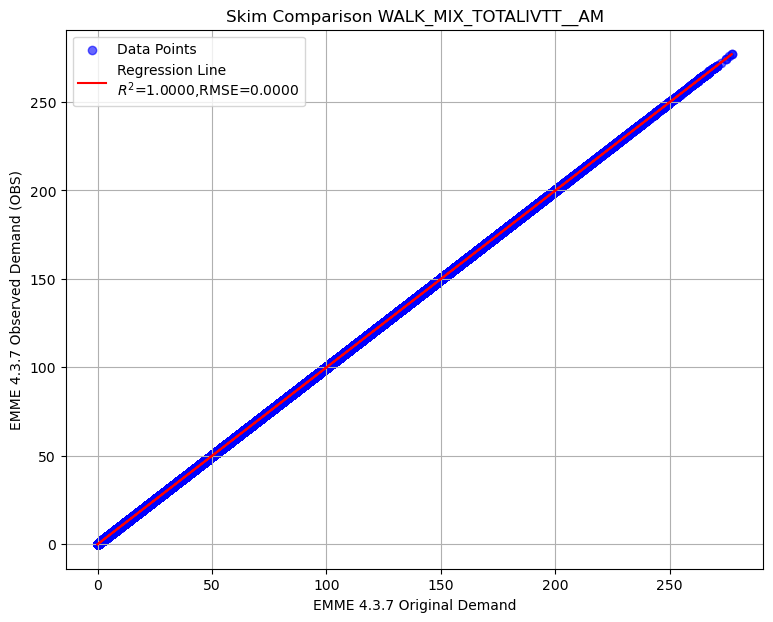
Summary of transit AM skim comparison (EMME 4.3.7 Observed Demand - EMME 4.3.7 Original Demand)
To display the top 5 rows of skim comparison (sort by WALK_PRM_TOTALIVTT__AM)
| Origin | Destination | WALK_PRM_TOTALIVTT__AM | WALK_PRM_LRTIVTT__AM | WALK_PRM_CMRIVTT__AM | WALK_PRM_EXPIVTT__AM | WALK_PRM_BRTIVTT__AM | WALK_LOC_TOTALIVTT__AM | WALK_MIX_TOTALIVTT__AM |
|---|---|---|---|---|---|---|---|---|
| 1626 | 504 | 32.02 | 20.81 | -58.57 | 0 | 69.78 | 0 | 0 |
| 1626 | 568 | 32.02 | 20.81 | -58.57 | 0 | 69.78 | 0 | 0 |
| 1626 | 723 | 32.02 | 20.81 | -58.57 | 0 | 69.78 | 0 | 0 |
| 1626 | 498 | 32.02 | 20.81 | -58.57 | 0 | 69.78 | 0 | 0 |
| 1665 | 419 | 19.46 | 10.88 | -26.31 | 0 | 34.89 | 0 | 0 |
Below is the summary of selected matrices difference in transit AM skim
| WALK_PRM_TOTALIVTT__AM | WALK_PRM_LRTIVTT__AM | WALK_PRM_CMRIVTT__AM | WALK_PRM_EXPIVTT__AM | WALK_PRM_BRTIVTT__AM | WALK_LOC_TOTALIVTT__AM | WALK_MIX_TOTALIVTT__AM | |
|---|---|---|---|---|---|---|---|
| count | 24,472,809.00 | 24,472,809.00 | 24,472,809.00 | 24,472,809.00 | 24,472,809.00 | 24,472,809.00 | 24,472,809.00 |
| mean | 0.00 | -0.00 | 0.00 | 0.00 | -0.00 | 0.00 | -0.00 |
| std | 0.04 | 0.02 | 0.07 | 0.01 | 0.08 | 0.00 | 0.00 |
| min | -32.02 | -20.81 | -58.57 | -0.00 | -69.78 | -0.00 | -0.00 |
| 25% | 0.00 | 0.00 | 0.00 | 0.00 | 0.00 | 0.00 | 0.00 |
| 50% | 0.00 | 0.00 | 0.00 | 0.00 | 0.00 | 0.00 | 0.00 |
| 75% | 0.00 | 0.00 | 0.00 | 0.00 | 0.00 | 0.00 | 0.00 |
| max | 32.02 | 20.81 | 58.57 | 5.39 | 69.78 | 0.00 | 0.00 |
Let’s check the records with difference in WALK_PRM_LRTIVTT__AM greater than 50
| Origin | Destination | WALK_PRM_TOTALIVTT__AM | WALK_PRM_LRTIVTT__AM | WALK_PRM_CMRIVTT__AM | WALK_PRM_EXPIVTT__AM | WALK_PRM_BRTIVTT__AM | WALK_LOC_TOTALIVTT__AM | WALK_MIX_TOTALIVTT__AM |
|---|
Let’s check the records with difference in WALK_PRM_LRTIVTT__AM less than -50
| Origin | Destination | WALK_PRM_TOTALIVTT__AM | WALK_PRM_LRTIVTT__AM | WALK_PRM_CMRIVTT__AM | WALK_PRM_EXPIVTT__AM | WALK_PRM_BRTIVTT__AM | WALK_LOC_TOTALIVTT__AM | WALK_MIX_TOTALIVTT__AM |
|---|---|---|---|---|---|---|---|---|
| 1626 | 462 | -32.02 | -20.81 | 58.57 | 0 | -69.78 | 0 | 0 |
| 1626 | 496 | -32.02 | -20.81 | 58.57 | 0 | -69.78 | 0 | 0 |
| 1626 | 575 | -32.02 | -20.81 | 58.57 | 0 | -69.78 | 0 | 0 |
| 1626 | 581 | -32.02 | -20.81 | 58.57 | 0 | -69.78 | 0 | 0 |
| 1626 | 821 | -32.02 | -20.81 | 58.57 | 0 | -69.78 | 0 | 0 |