Scenarios to be compared: EMME 4.3.7 Base year scenario VS OpenPaths Base year scenarioPM Peak travel distance skim for SOV NT
Scatterplot comparison of PM Peak SOV_NT distance
Intercept: 0.0010
Slope: 1.0003
R² Score: 0.9998
RMSE: 0.2579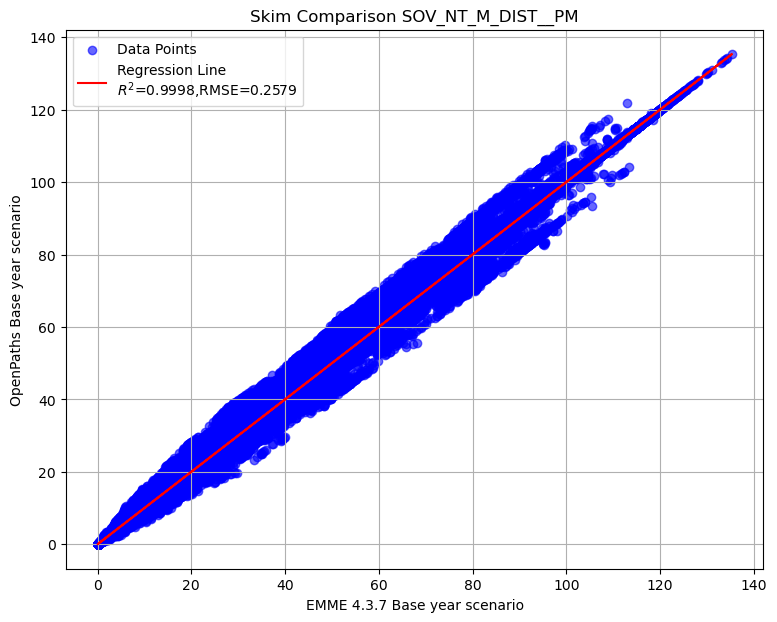
Comparison table of select matrix from PM Peak traffic skim (top 5)
| Origin | Destination | SOV_NT_M_DIST__PM |
|---|---|---|
| 1196 | 4872 | 11.51 |
| 300 | 4753 | 10.87 |
| 1319 | 4867 | 10.70 |
| 1354 | 4867 | 10.70 |
| 1311 | 4867 | 10.70 |
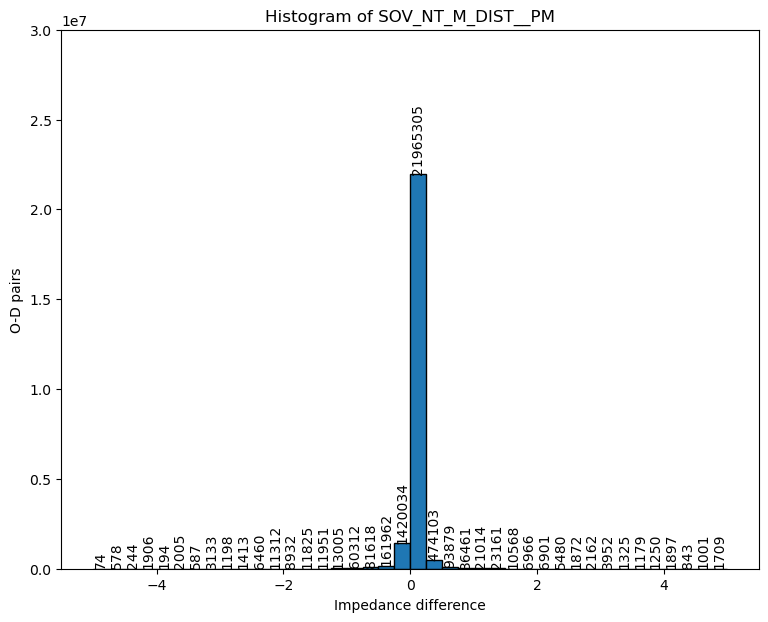
Summary of Comparison on SOV_NT_M_DIST__PM between EMME OpenPath and EMME437
      SOV_NT_M_DIST__PM
count     24,472,809.00
mean               0.01
std                0.26
min              -12.47
25%                0.00
50%                0.00
75%                0.00
max               11.51