Development
Needs 
The time needed to configure, run, and summarize results from ABM2+ is too slow to support a nimble, challenging, and engagement-oriented planning process. SANDAG needed a tool that quickly approximates the outcomes of ABM2+. The rapid strategic model, or RSM, was built for this purpose.
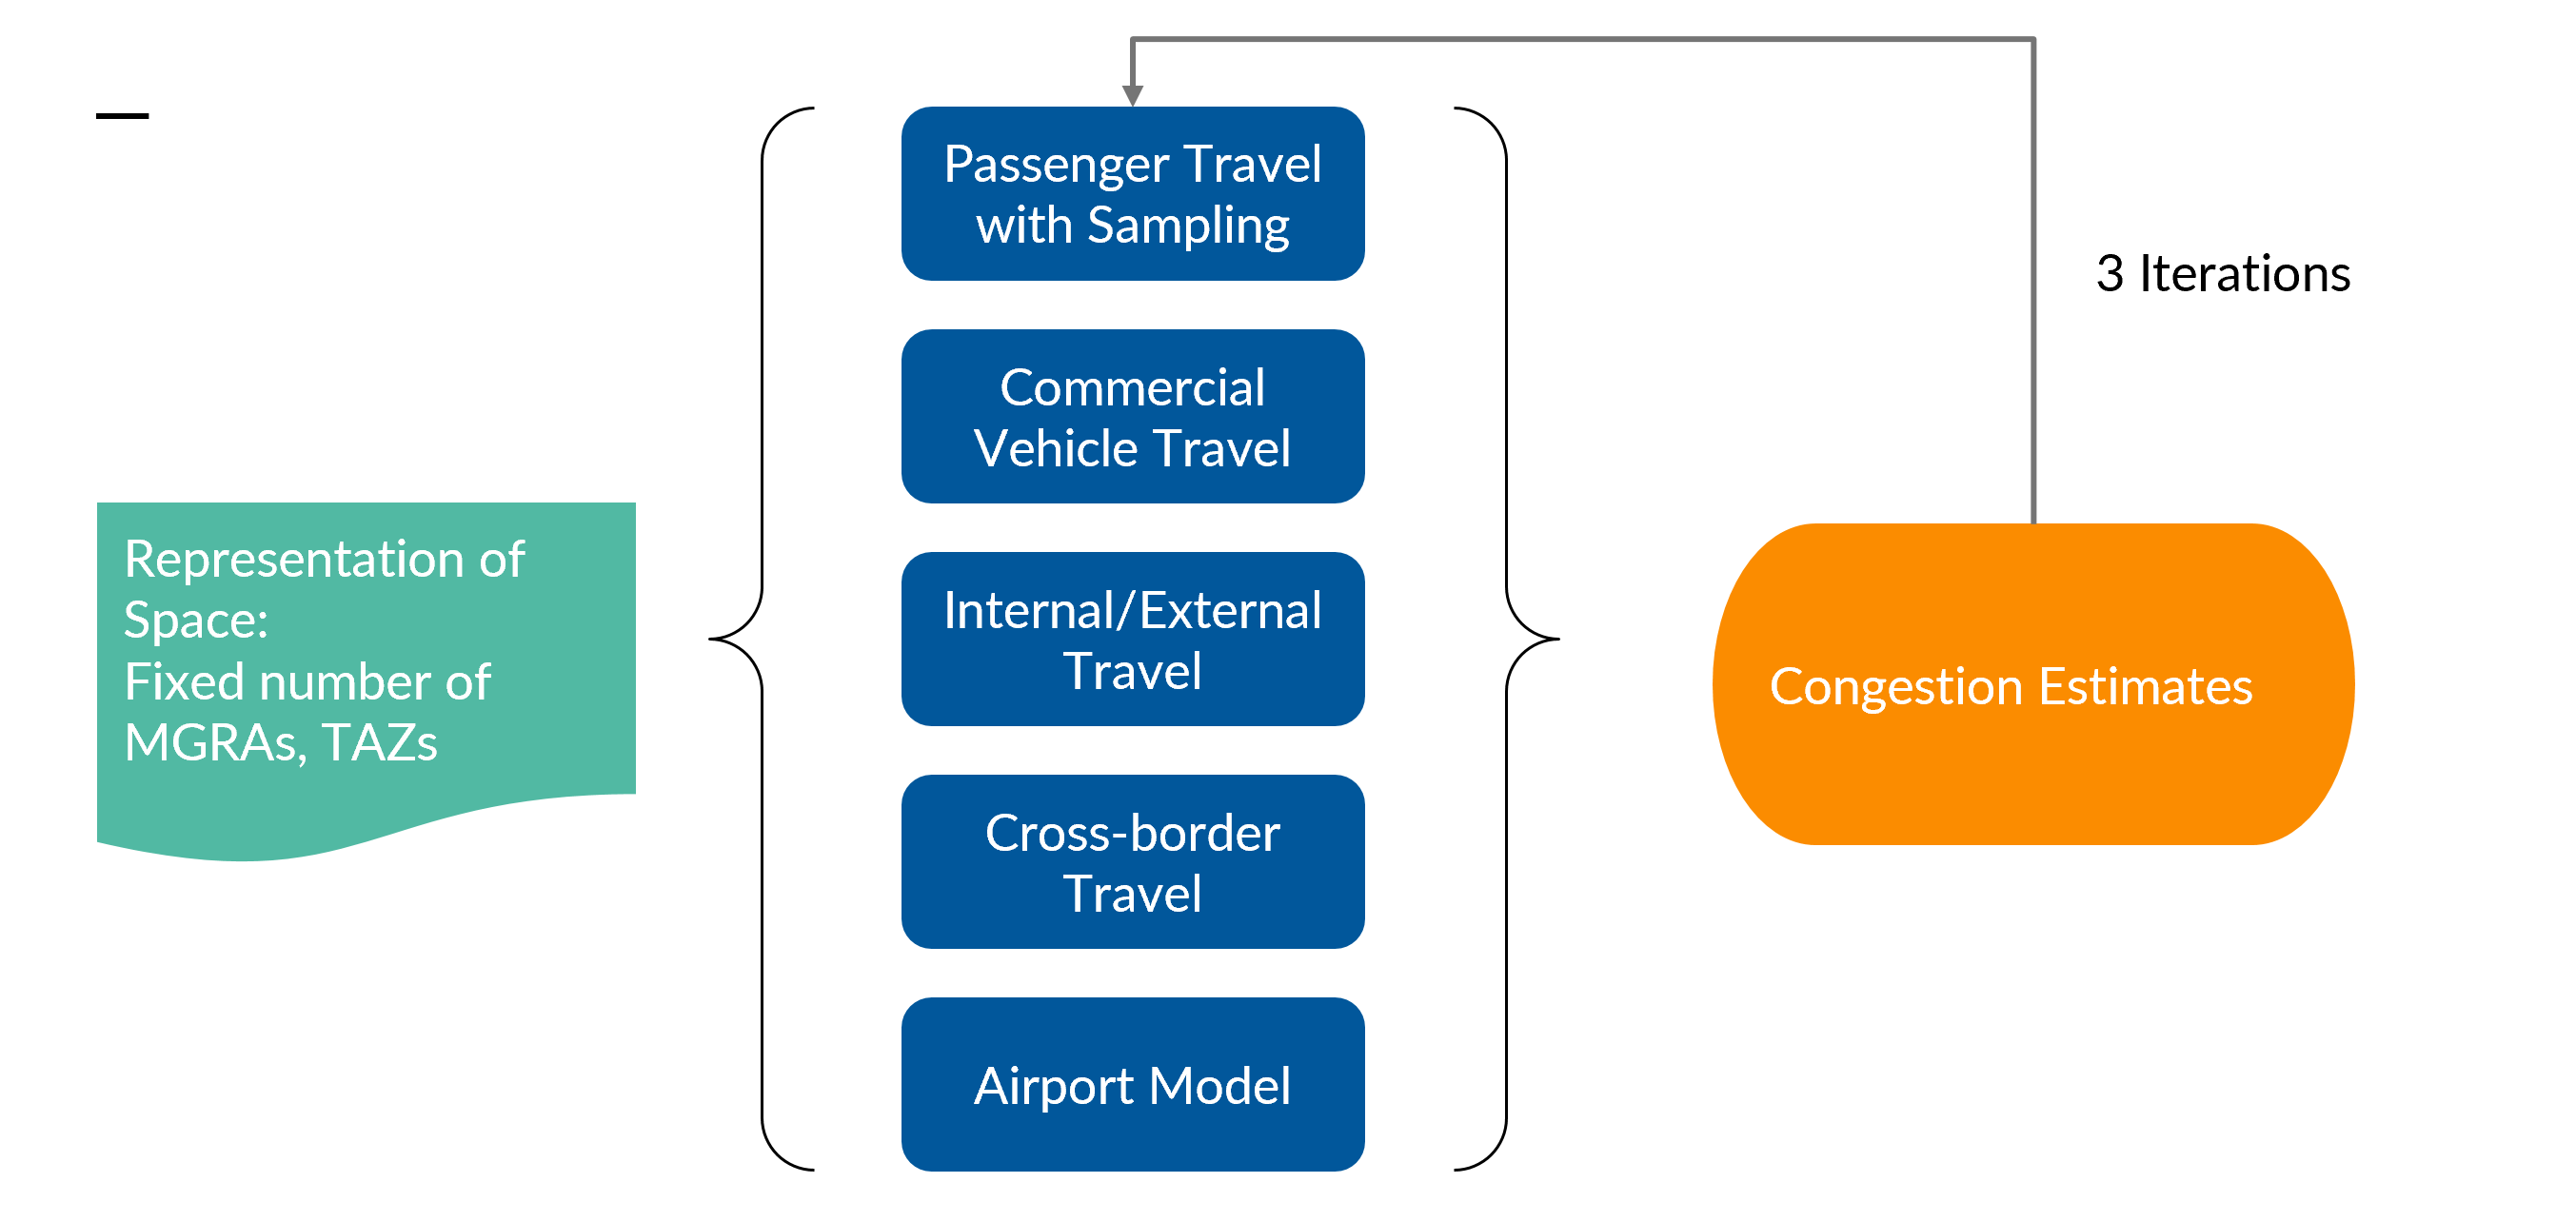
ABM2+ Schematic is shown below
Design Considerations 
Reducing the number of zones reduces model runtime.
- MGRAs are aggregated into Rapid Zones based on their proximity to each other and similarity in regards to mode choice decisions.
- RSM will have variable number of analysis zones and that can be quickly changed to assess trade-offs between runtime and how well the RSM results match the ABM2+ results.
- Initial testing revealed 2,000 rapid zones is approximately optimal and will be used in initial deployments. For reference, ABM2+ has ~23,000 MGRAs and ~5,000 TAZs.
Reducing the number of model components reduces runtime.
- Most, but not all, of the policies of interest to SANDAG primarily impact resident passenger travel.
- Therefore, RSM will only run passenger travel component while maintaining the other demand components fixed.
Reducing the number of global iterations reduces runtime.
- If the RSM results are in the same ballpark as ABM2+, reduce the number of global iterations from 3 to 2 for the model.
Reducing sample rate reduces runtime.
- Runtime of the resident model will reduce if less population is simulated.
- ABM2+ simulates population as 25 percent (first iteration), 50 percent (second iteration) and 100 percent (third iteration).
- RSM will attempt to intelligently sample population and vary it by TAZ with higher sample rate in zones with large changes in accessibility and lower rates in zones with small changes in accessibility.
- RSM could also have higher sampling in zones around the analysis project and lower elsewhere.
Architecture 
The RSM is developed as a Python package and the required modules are launched when running the existing SANDAG travel model as Rapid Model. It takes as input a complete ABM2+ model run and has following modules:
Zone Aggregator 
The RSM zone creator/aggregator creates a set of RSM analysis zones (Rapid Zones) and a set of RSM input files compatible with the zone system, using a donor model run (ABM2+/ABM3) as input. The inputs include the MGRA shapefile (MGRASHAPE.zip), MGRA socioeconomic file (example: mgra13_based_input2016.csv), individual trips (indivTripData_3.csv), from the donor model. It produces a new MGRA socioeconomic file with new RSM zones and crosswalk files between original TAZ/MGRA and the rapid zones. Along with the inputs, the user can specify other parameters such as number of RSM zones, donor model run directory, number of external zones, MGRA socioeconomic file, names of crosswalk files generated by the zone aggregator module, optional study area file (to study localized changes in the region) and RSM zone centroid csv files in the model properties file (sandag_abm.properties).
At the core of the RSM zone aggregator, the module performs several steps. The MGRA geographies are loaded from shapefiles, MGRA data is loaded from the MGRA socioeconomic file, and trip data is extracted from the individual trip file. Additional computations, like intersection counts and density variables, are performed on the MGRA data. The script aggregates the MGRA’s attributes to create a new zone data based on “TAZ” (Traffic Analysis Zone). The individual trips file is used to calculate the mode shares for each TAZ. Additional travel time between TAZs to the point of interest (default includes San Diego city hall, outside Pendleton gate, Escondido city hall, Viejas casino, and San Ysidro trolley) are also added to the aggregated data by TAZ. The TAZs are further clustered to a user-defined number of RSM zones using several cluster factors (default factors and their weights are as follows: “popden”: 1, “empden”: 1, “modeshare_NM”: 100, “modeshare_WT”: 100) and clustering algorithm. The current scripts support KMeans and agglomerative clustering algorithms to cluster the TAZs. In case the user has specified a study area, the function separately handles them and aggregates them into their clusters based on the specification provided in the study area file. The remaining TAZs are aggregated based on the aggregation algorithm.
After the clustering, the aggregator produces the TAZ/MGRA crosswalks between old TAZs/MGRAs to new RSM zones. The elementary and high school enrollments are further checked and adjusted in the new RSM zone socioeconomic to prevent zero values.
The user can also control the execution of the zone aggregator from the properties file. Once a baseline RSM run is established, other project related RSM can be setup to skip running the zone aggregator and the zone system from the RSM baseline can be used. Please note that MGRA and TAZs are essentially same geographically in the RSM model run except their numbering is different.
Input Aggregator 
The input aggregator module of RSM aggregates several input files, uec (soa) files, non-abm model outputs of the donor model based on the new RSM zones. The main inputs to this module include the location of the donor model, RSM socioeconomic file, TAZ and MGRA crosswalks. The module reads the original socioeconomic file and adds intersection count and several density variables that were originally generated by the 4D module of the current ABM2+ model. This is done here in RSM because the 4D module is skipped when running RSM. The module then uses the MGRA crosswalks between MGRA and RSM zones to aggregate the original socioeconomic file data based on the new RSM zones to create a new RSM specific socioeconomic file. Next, the module aggregates the following input files:
| File Name | Aggregation Columns | Aggregation Methodology |
|---|---|---|
| microMgraEquivMinutes.csv | walkTime, dist, mmTime, mmCost, mtTime, mtCost, mmGenTime, mtGenTime, minTime | Mapped MGRA to RSM zones and aggregated the columns by taking mean. |
| microMgraTapEquivMinutes.csv | walkTime, dist, mmTime, mmCost, mtTime, mtCost, mmGenTime, mtGenTime, minTime | Mapped MGRA to RSM zones and aggregated the columns by taking mean. |
| walkMgraTapEquivMinutes.csv | boardingPerceived, boardingActual, alightingPerceived, alightingActual, boardingGain, alightingGain | Mapped MGRA to RSM zones and aggregated the columns by taking mean. |
| walkMgraEquivMinutes.csv | percieved, actual, gain | Mapped MGRA to RSM zones and aggregated the columns by taking mean. |
| bikeTazLogsum.csv | logsum, time | Mapped TAZ to RSM zones and aggregated the columns by taking the mean. |
| bikeMgraLogsum.csv | logsum, time | Mapped MGRA to RSM zones and aggregated the columns by taking the mean. |
| zone.term | terminal_time | Mapped TAZ to RSM zones and took the maximum. |
| zones.park | park_zones | Mapped TAZ to RSM zones and took the maximum. |
| tap.ptype | Mapping RSM zones to TAZs | |
| accessam.csv | TIME, DISTANCE | |
| ParkLocationAlts.csv | parkarea | Mapped MGRA to RSM zones and took the minimum. |
| CrossBorderDestinationChoiceSoaAlternatives.csv | Mapping MGRA to RSM Zones | |
| TourDcSoaDistanceAlts.csv | a, mgra | It is recreated with RSM zones |
| DestinationChoiceAlternatives.csv | a, mgra | It is recreated with RSM zones |
| SoaTazDistAlts.csv | a, dest | It is recreated with RSM zones |
| TripMatrices.csv | CVM_ XX:LT, CVM_ XX:IT, CVM_ XX:MT, CVM_ XX:HT, CVM_XX:LNT, CVM_XX:INT, CVM_XX:MNT, CVM_XX:HNT where XX = EA, AM, MD, PM, EV |
Mapped TAZ to RSM zones and aggregated the columns by taking the sum. |
| transponderModelAccessibilities.csv | DIST,AVGTTS,PCTDETOUR | Mapped TAZ to RSM zones and aggregated the columns by taking the mean. |
| crossBorderTours.csv | Mapped MGRA/TAZs to RSM zones | |
| internalExternalTrips.csv | Mapped MGRA/TAZs to RSM zones | |
| visitorTours.csv | Mapped MGRA to RSM zones | |
| visitorTrips.csv | Mapped MGRA to RSM zones | |
| householdAVTrips.csv | Mapped MGRA to RSM zones | |
| airport_out.SAN.csv | Mapped MGRA/TAZ to RSM zones | |
| airport_out.CBX.csv | Mapped MGRA/TAZ to RSM zones | |
| TNCtrips.csv | Mapped MGRA/TAZ to RSM zones | |
| TRIP_ST_XX.CSV where ST (Sector Type) = FA, GO, IN, RE, SV, TH, WH; XX (Time Period) = OE, AM, MD, PM, OL |
Mapped TAZ to RSM zones |
More details on the the above files can be found here.
Translate Demand 
The translate demand module of the RSM aggregates the non-resident demand matrices and trip tables based on the new RSM zone structure. The inputs of this module includes the path to the RSM model directory, donor model directory and crosswalks. In particular the module aggregates the demand from auto, transit, non-motorized, other trips from the airport, cross border, internal external and visitor model. It also aggregated TNC vehicle trips and empty AV trips.
Intelligent Sampler 
The intelligent sampler module is designed to intelligently sample households and persons from synthetic households and person data, considering accessibility metrics and other parameters. The main inputs to this module are the households file, person file, TAZ/MGRA crosswalks and the outputs are sampled households and person files. In the model properties file (sandag_abm.properties), the user can choose to run RSM sampler, specify the default sampling rate, and minimum sampling rate for the RSM model run. The user also has the ability to sample specific zones at 100% by specifying them in the study area file and turn on the differential sampling indicator (use.differential.sampling equals to 1).
The sampler function follows these primary steps:
-
Zone Mapping: The function maps zones from the synthetic households/person data to their corresponding RSM zones using crosswalk data.
-
Household Sampling:
- If accessibility data is missing (first iteration) or if the RSM sampler is turned off, a default sampling rate is applied to all RSM zones, with optional 100% sampling in the study area.
-
If accessibility data is available and the RSM sampler is turned on, the function calculates differences in accessibility metrics between the current and previous iterations. The sampling rates are determined based on these differences and are adjusted to be within specified bounds. The RSM zones of the study area are sampled at a 100% sampling rate if the differential sampling indicator is turned on.
-
Households and Persons Selection: The function selects households based on the calculated sampling rates. It also selects persons associated with the sampled households.
-
Output: The selected households and persons are written to output CSV files in the specified output directory. The function also computes and logs the total sampling rate, representing the proportion of selected households relative to the total number of households.
Note that in the current RSM deployment, sampler is set to use 25% default sampling rate. The intelligent sampler needs further testing to be used to sample households using the accessibility change.
Intelligent Assembler 
The intelligent assembler module assembles the trips of RSM model run and scale them appropriately based on the sampling rate of the RSM zones. The main inputs to this module are joint and individual trips from the donor and RSM model, households file, crosswalks for mapping zones, optional study area file and a flag to running the assembler.
The assembler function follows these primary steps:
-
Load Trip Files: The function reads the individual and joint trip data for the RSM run. If the assembler is set to run (flag
run_assemblerequals 1), the function also loads the corresponding trip data from the donor model run. -
Assemble Trips: It converts individual and joint trip data from both the RSM run and the original model run into a common table format using a merging process. It separates trips made by households in the RSM run and those that were not resimulated. Then, it combines these trips to create the final assembled trip data, including individual and joint trips.
-
Evaluation of Trip Changes: The function calculates and evaluates the percentage change in total trips by mode for each home zone. It aggregates trips made by households in the RSM and original model runs and compares their trip counts by mode. This information is used to assess the stability of travel behavior in different zones.
-
Alternative Behavior (If Assembler is Off): If the assembler is turned off (flag
run_assemblerequals 0), the function scales the RSM individual and joint trips based on the specified default sampling rate. This alternative behavior is intended to simulate all trips as if they were selected, eliminating the need for the assembler. If the study area file is present and the differential sampling is turned on(use.differential.samplingequals to 1), then the trips made by residents of the study area are not scaled based on the RSM deafult sampling rate. -
Outputs: The function returns two outputs: individual trips containing the assembled individual trip data, and joint trips containing the assembled joint trip data. These data files are structured to align with the format required for further analysis or use by Java components.
In summary, the RSM assembler module takes multiple trip datasets and assembles them to create a unified dataset for further analysis, accommodating cases where only a subset of households were resimulated. The function also evaluates changes in trip behavior across different zones.
User Experience 
The RSM repurposes the ABM2+ Emme-based GUI. The options will be updated to reflect the RSM options, as will the input file locations and other parameters. The RSM user experience will, therefore, be nearly the same as the ABM2+ user experience.