Assessment
RSM Configuration 
The team conducted tests using different combinations for the RSM parameters, including the number of RSM zones (1000, 2000), default sampling rates (15%, 25%, 100%), enabling or disabling the intelligent sampler, and choosing the number of global iterations (2 or 3), among other factors. The most significant influence of the number of RSM zones was observed on the runtime of the highway assignment process. Since the highway assignment runtime was already low with 1000 RSM zones, there was no motivation to explore lower RSM zone number. Altering the sampling rate had a greater impact on the runtime of the demand model (CT-RAMP) compared to changing the number of RSM zones. These test runs exhibited varying runtimes depending on the specific configuration. Key metrics at the regional level were analyzed across these different test runs to comprehend the trade-off between improved runtime for RSM and achieving RSM results that are similar to ABM. Based on this, the team collectively determined that for the MVP (Minimum Viable Product) version of the RSM, the “optimal” configuration would be to use 2000 RSM zones, a 25% default sampling rate, the intelligent sampler turned off, and 2 global iterations and this RSM configuration was used to move forward with the overall assessment of the RSM.
Calibration 
Aggregating the ABM zones to RSM zones, distorts the walk trips share coming out of the model. With the model configuration (Rapid Zones, Global Iterations, Sample Rate, etc.) for RSM as identified above, tour mode choice calibration was performed to match the RSM mode share to ABM2+ mode share, primarily to match the walk trips. A calibration constant was applied to the tour mode choice UEC to School, Maintenance, Discretionary tour purpose. The mode share for Work and University purpsoe were reasonable, therefore the calibration wasn’t applied to those purposes.
RSM specific constants were added to the Tour Mode Choice UEC (TourModeChoice.xls) to some of the tour purposes. The Walk mode share for the Maintenance and Discretionary purposes was first adjusted by calibrating and applying n RSM specific constant row to the UEC. Furthermore, in cases where the tour involved escorting for Maintenance or Discretionary purposes, an additional calibration constant was introduced to further adjust the walk mode share for such escort tours. Similarly, a differeent set of constants were added to calibrate the School tour purpose. There was no need to calibrate mode choice for any other tour purpose as those were reasonable from RSM.
Note that a minor calibration will be required for RSM when number of rapid zones are changed.
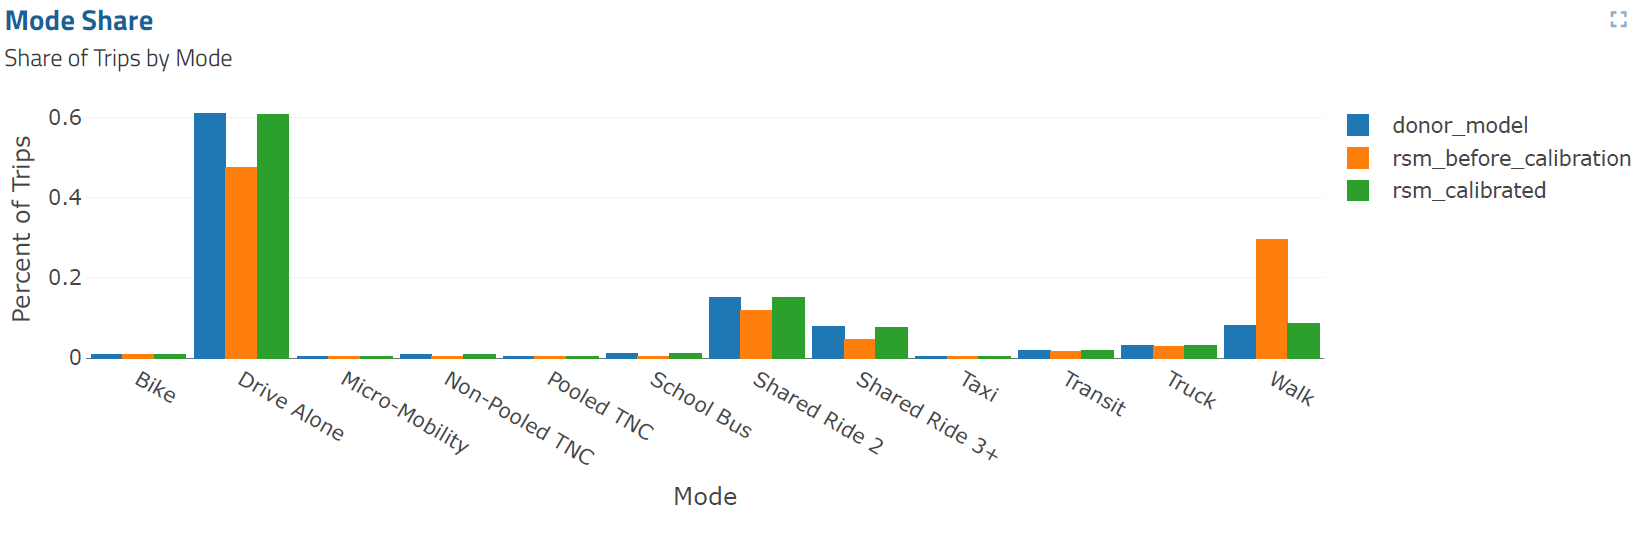
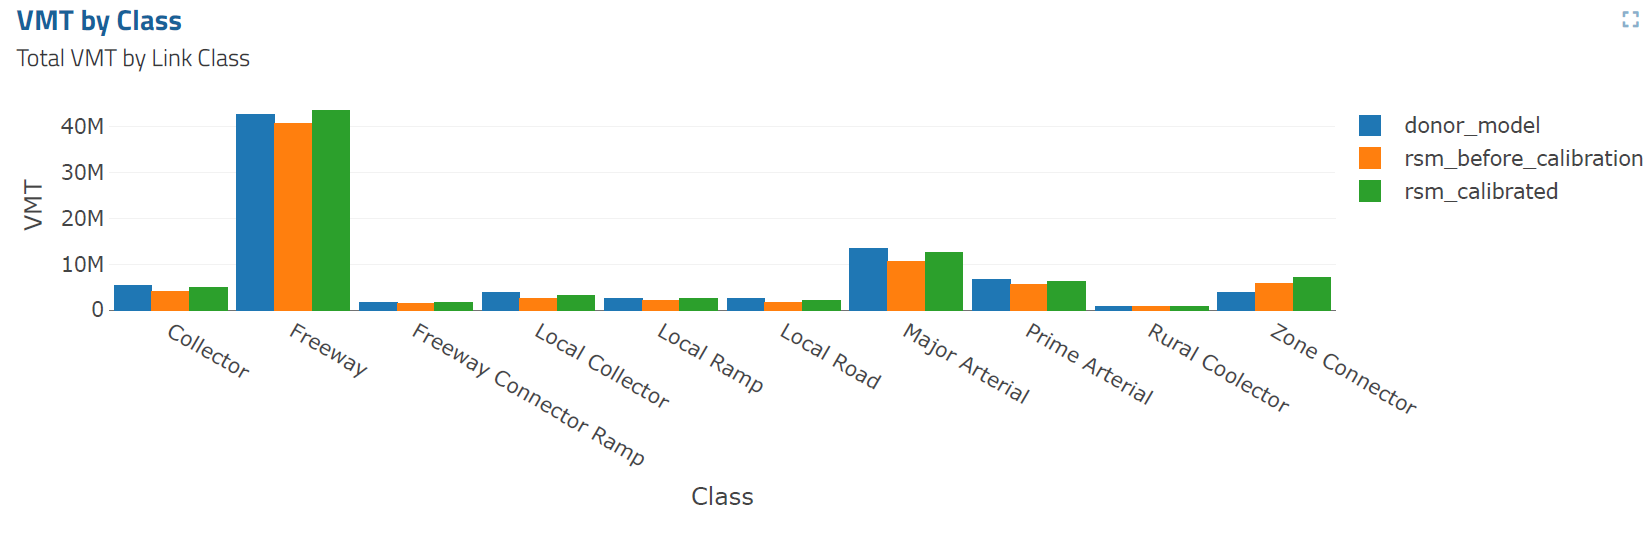
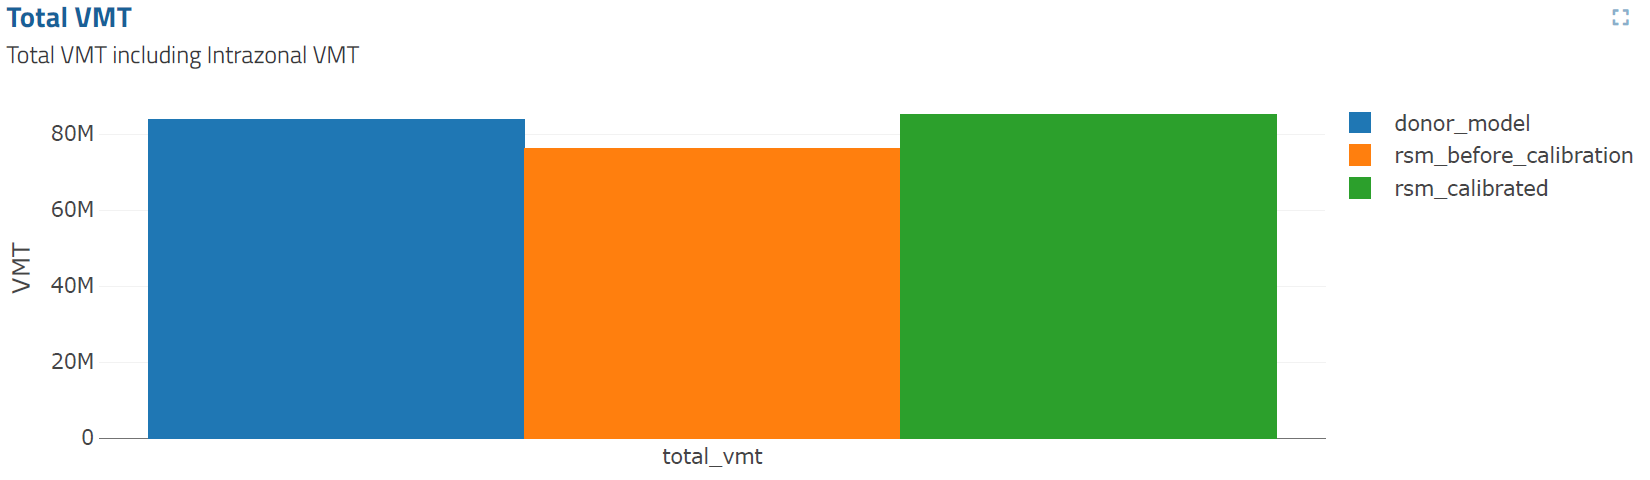
Here is how the mode share and VMT compares before and after the calibration for RSM. Donor model in the charts below refers to the ABM2+ run.
Base Year Validation 
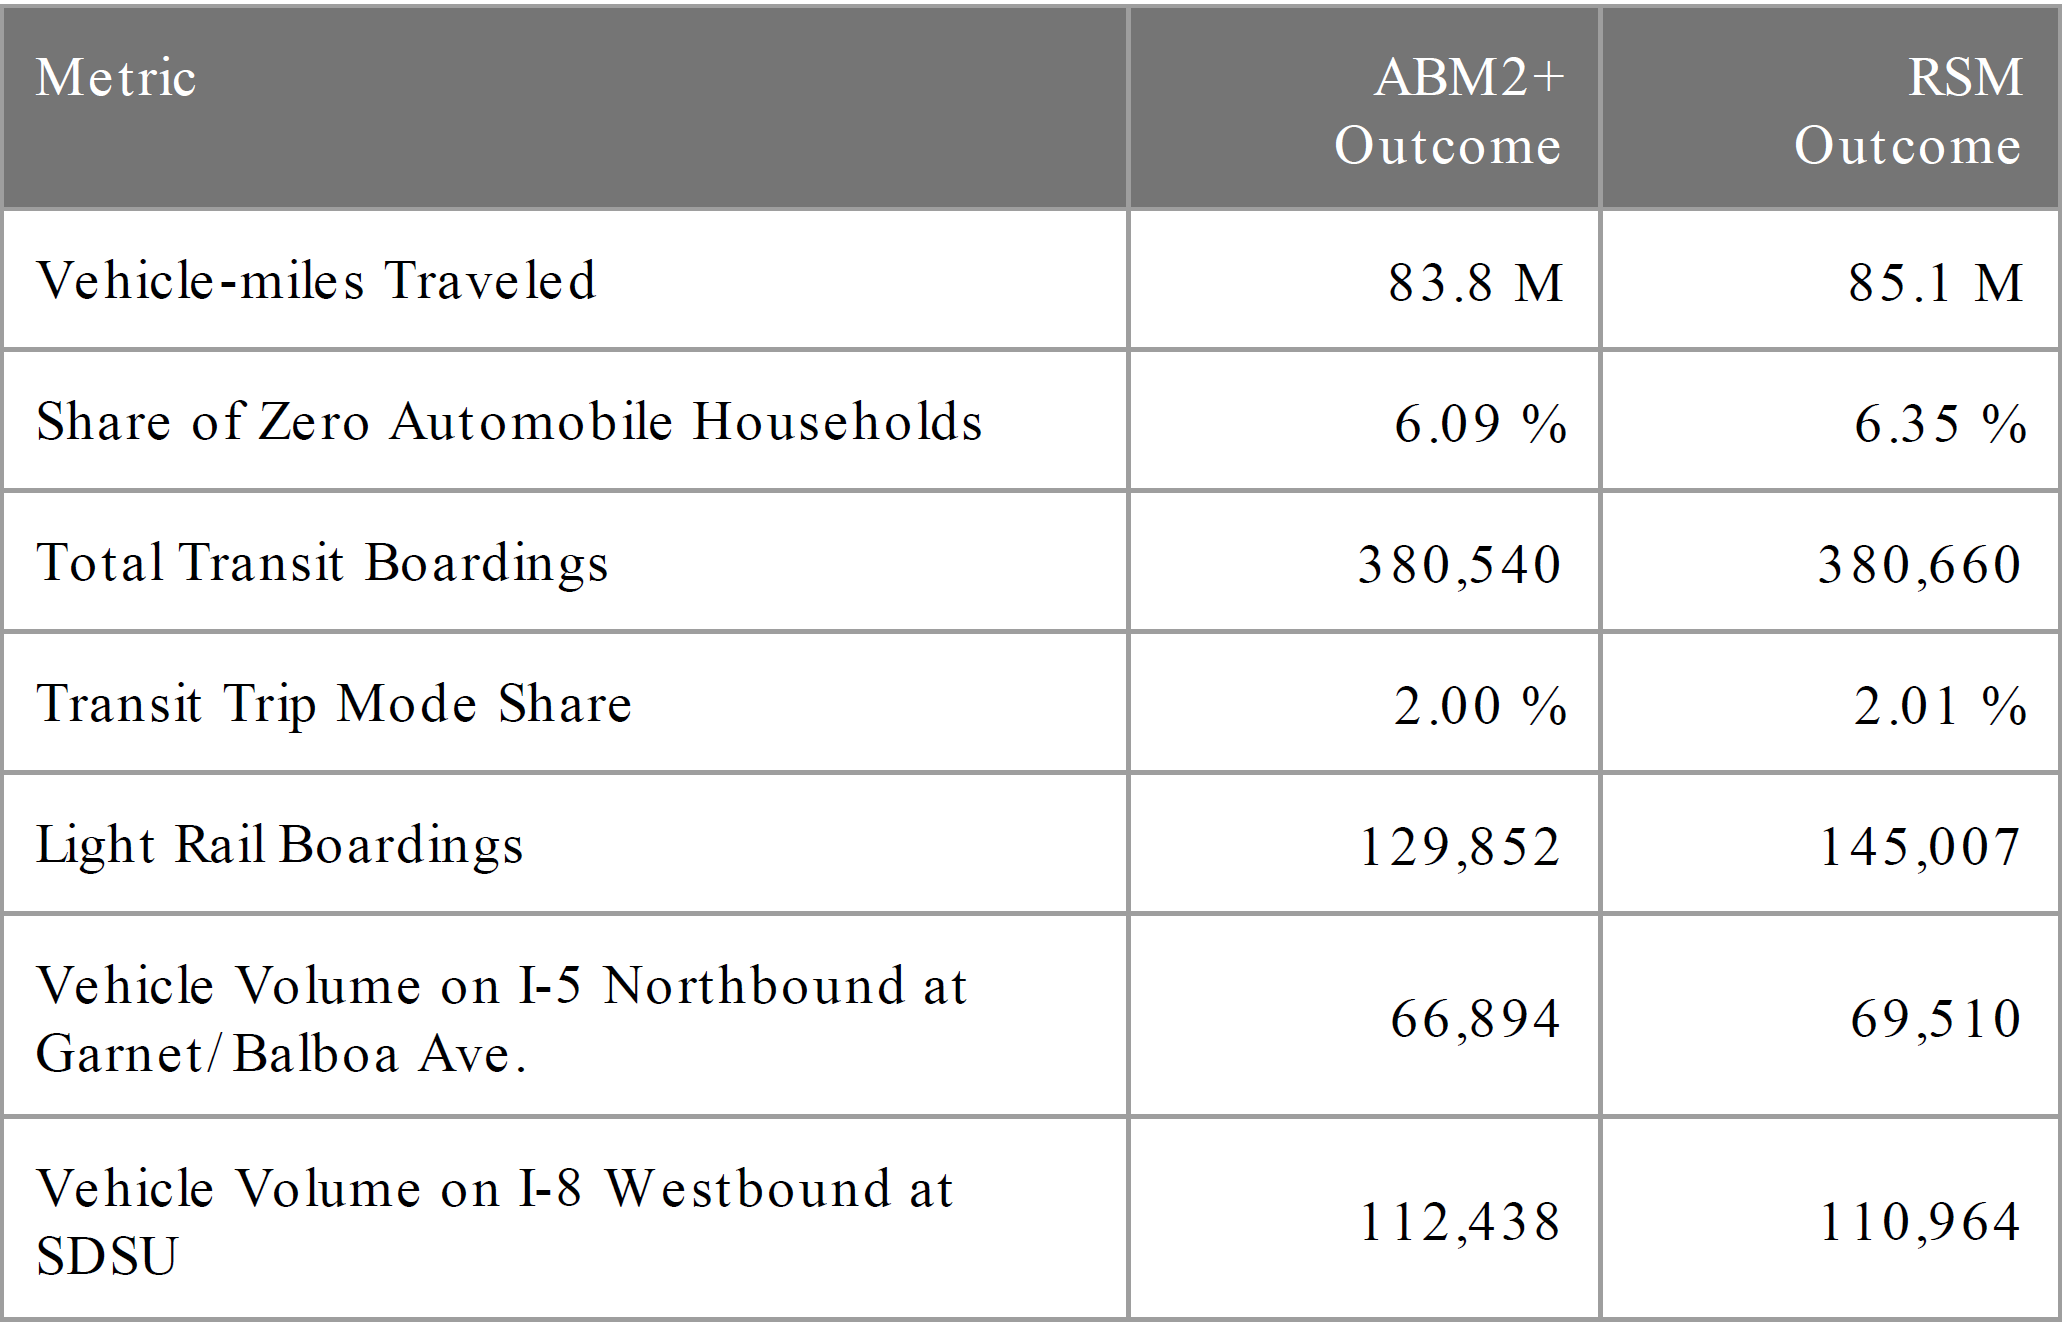
Here is the table of ABM2+ and RSM outcome comparison after the RSM calibration. The metrics used are some of the regional level key metrics. Volume comparison for the roadway segment on I-5 and I-8 were chosen at random.
Runtime Comparison 
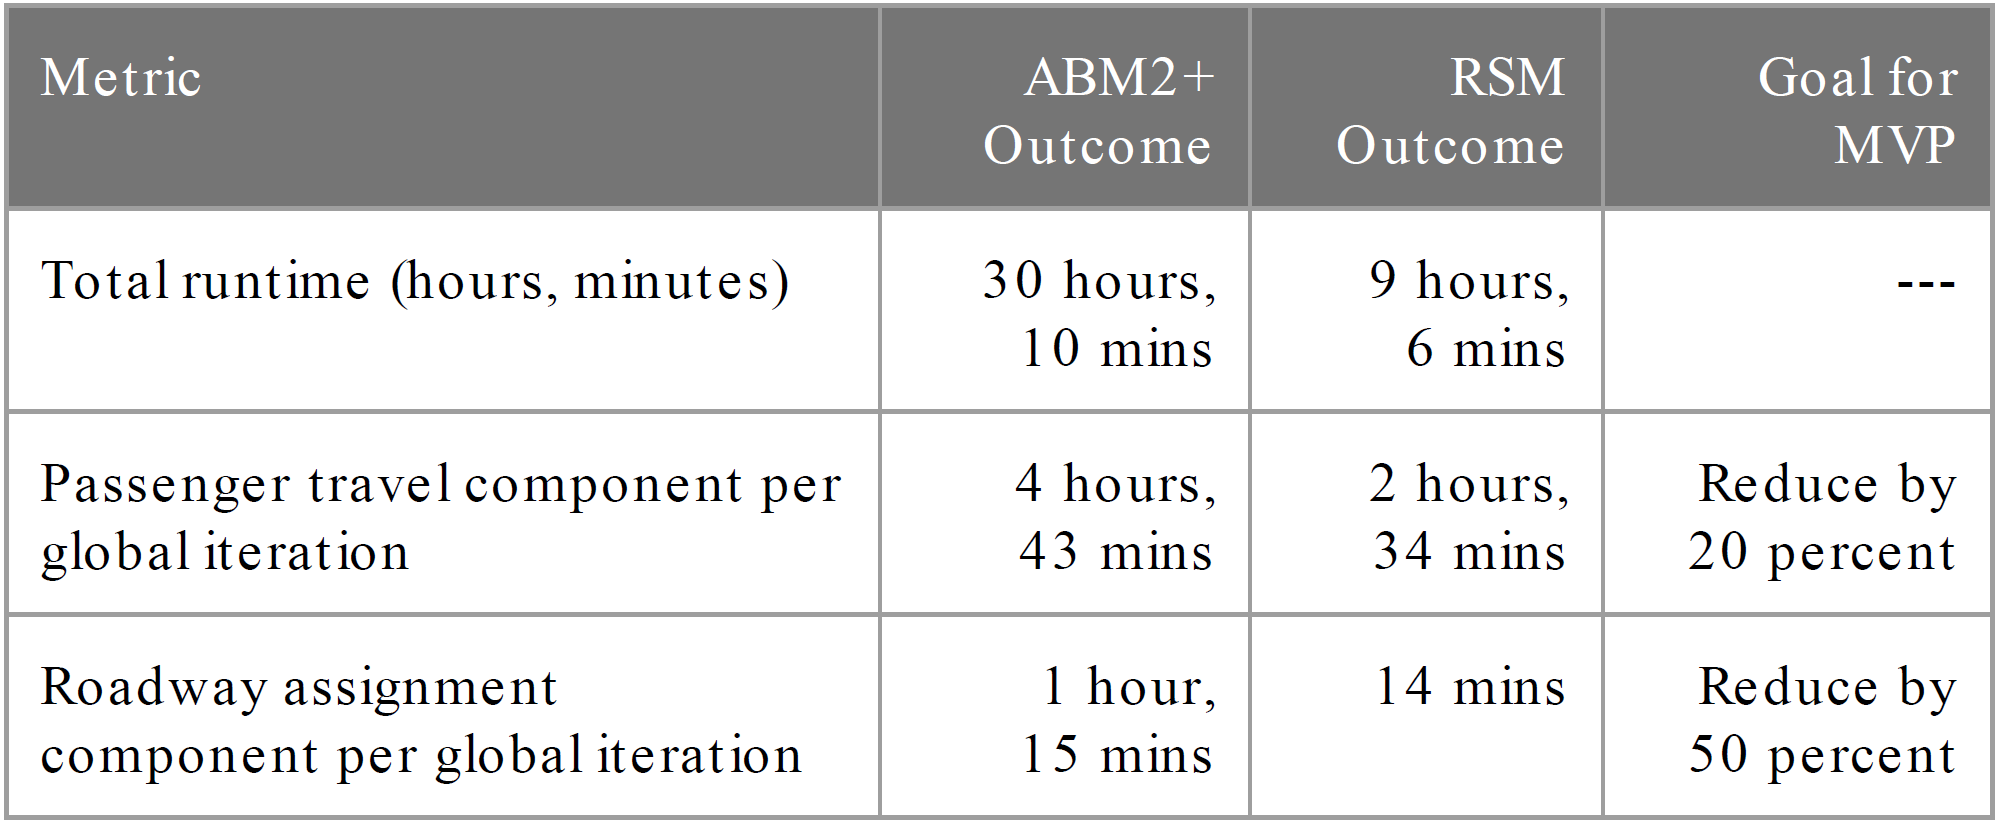
For base year 2016 simulation, below is the runtime comparison of ABM2+ vs RSM.
Sensitivity Testing 
After validating the RSM for base year with the chosen design configuration, RSM was used to carry out hypothetical planning studies related to some broader use-cases. Model results from both RSM and ABM2+ were compared for each of the sensitivity test to assess the performance of RSM and evaluate if RSM could be a viable tool for such policy planning.
For each test, a few key metrics from ABM2+ No Action, ABM2+ Action, RSM No Action and RSM Action scenario runs were compared. The goal was to have RSM and ABM2+ show similar sensitivities for action vs no-action.
Regional Highway Changes 
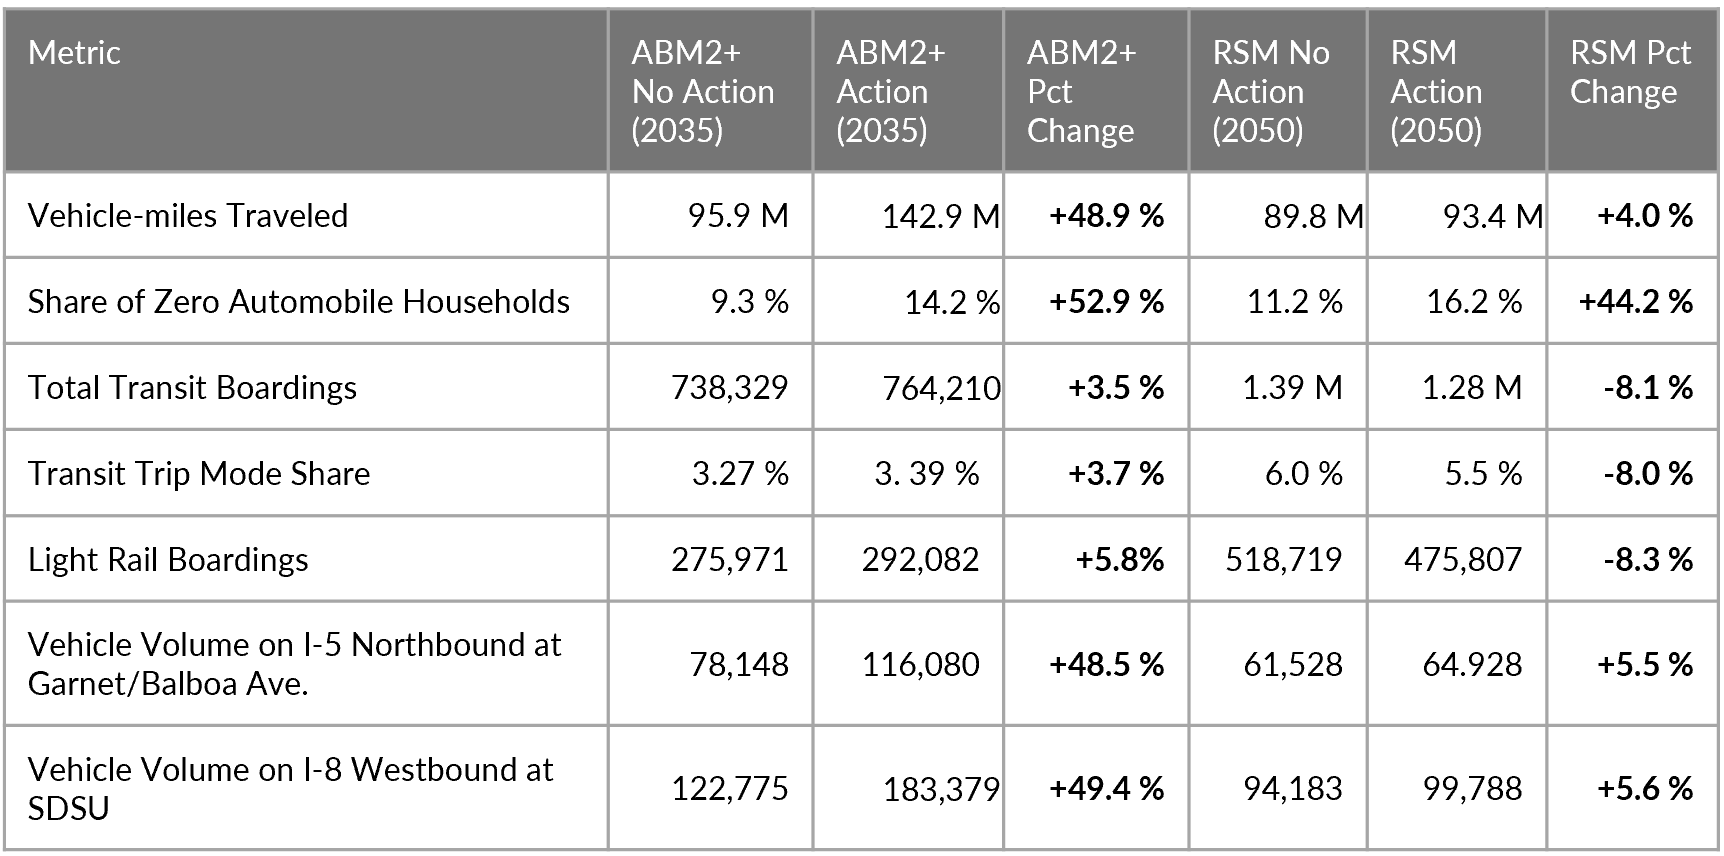
Auto Operating Cost - 50% Increase 

Auto Operating Cost - 50% Decrease 
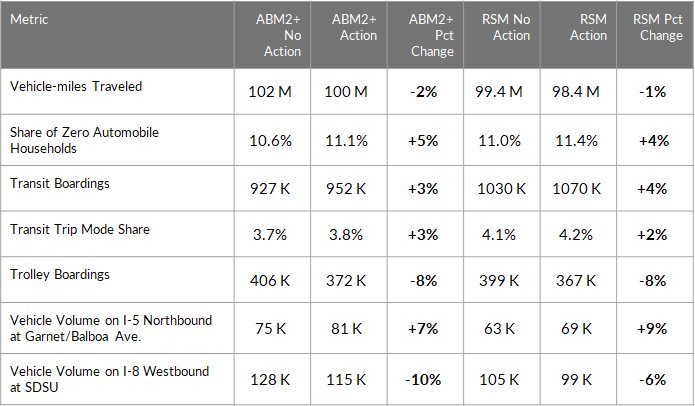
Ride Hailing Cost - 50% decrease 
Automated Vehicles - 100% Adoption 
In SANDAG model, the AV adoption is analyzed by capturing the zero occupancy vehicle movement as simulated in the Household AV Allocation module. For RSM, this AV allocation module is skipped, which is why RSM is not a viable tool for evaluating policies related to automated vehicles.
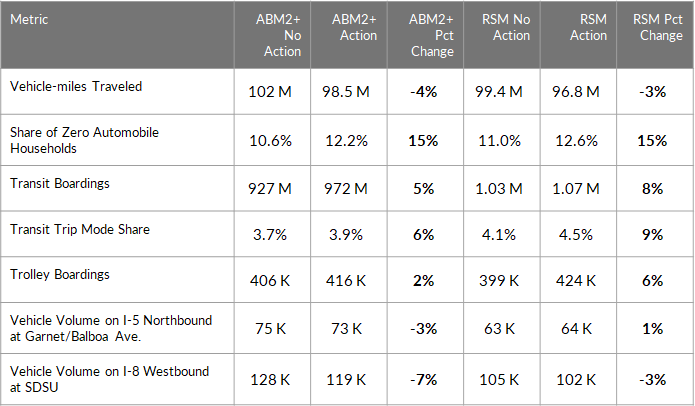
Land Use Changes 
RSM and ABM2+ shows similar sensitivities for the two tested scenarios with land use change.
Change in land use - Job Housing Balance 
Change in land use - Mixed Land Use 
Regional Transit Changes 
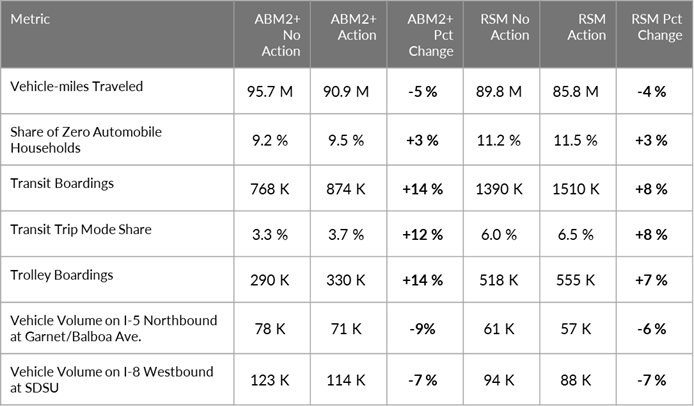
Transit Frequency 
The RSM and ABM generally match on changes in regional metrics when the transit frequency is globally doubled.
![]()
Local Highway Changes 
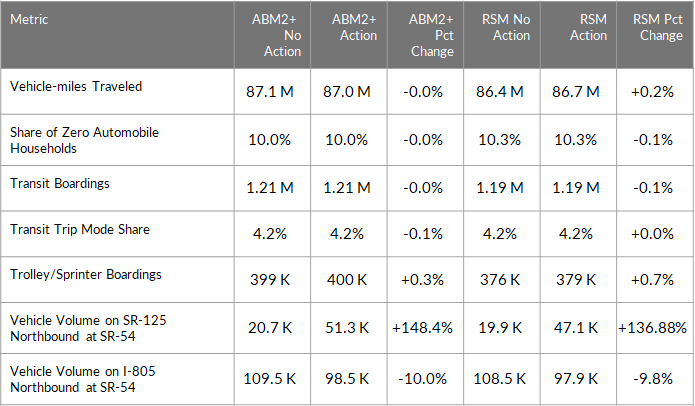
Toll Removal 
The removal of the toll on SR-125 (The South Bay Expressway) was tested in both ABM and RSM. In both models, volumes on SR-125 increased and volumes on I-805 at the same point decreased.
Local Transit Changes 
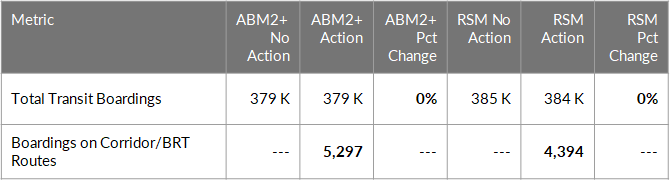
Rapid 637 BRT 
Tests were conducted that added the planned Rapid 637 line from North Park to the Naval Facilities to the base year network. Without the study area definition there were around 3,000 boardings from the RSM, but the addition of a study area resulted in a value much closer to the one produced by ABM2+.